“Under any scenario, future shale growth looks set to slow dramatically.”
Developments in the US shale basins have never been more important for global crude fundamentals. Over the past decade, the US has represented more than 100% of total non-OPEC growth and this growth has come exclusively from the shales. Had it not been for the US shales, the global oil market would have been in serious deficit.
We have been shale investors since their start over 15 years ago and have followed the trends extremely closely. In our Q1 2019 letter, we explained how we took our knowledge of the shales and combined it with the latest statistical techniques. Using artificial-intelligence tools from Google, cloud computing resources from Amazon, and well data from ShaleProfile, we built a “deep neural network” to analyze trends in the three major shale oil basins (the Eagle Ford, Bakken, and Permian).
ACCESS OUR Q1 2019 LETTER HERE: The Bell Has Been Rung
Most people (including us), believed that improvements in drilling and completion techniques had driven the recent increase in well productivity. Instead, our models now tell us that the E&P industry had undertaken a massive high-grading exercise. Operators had gone from drilling approximately 50% Tier 1 wells in 2014 to nearly 70% today.
We also confirmed a long-held belief (echoed by shale pioneers such as Mark Papa) that a Tier 1 well was approximately twice as productive as a Tier 2 well (all else being equal). Furthermore, we realized that enhancements in drilling and completion techniques (namely, longer wells and larger, more sand-intense frac jobs) were not delivering nearly as much productivity gains as originally believed. The implications were tremendous. Considering the rapidly dwindling inventory of undrilled Tier 1 acreage (primarily in the Bakken and Eagle Ford), we stated that drilling productivity was set to slow dramatically as companies were forced to drill increasing amounts of less productive Tier 2 acreage. We concluded that the only source of non-OPEC growth over the past decade was at risk of disappointing materially.
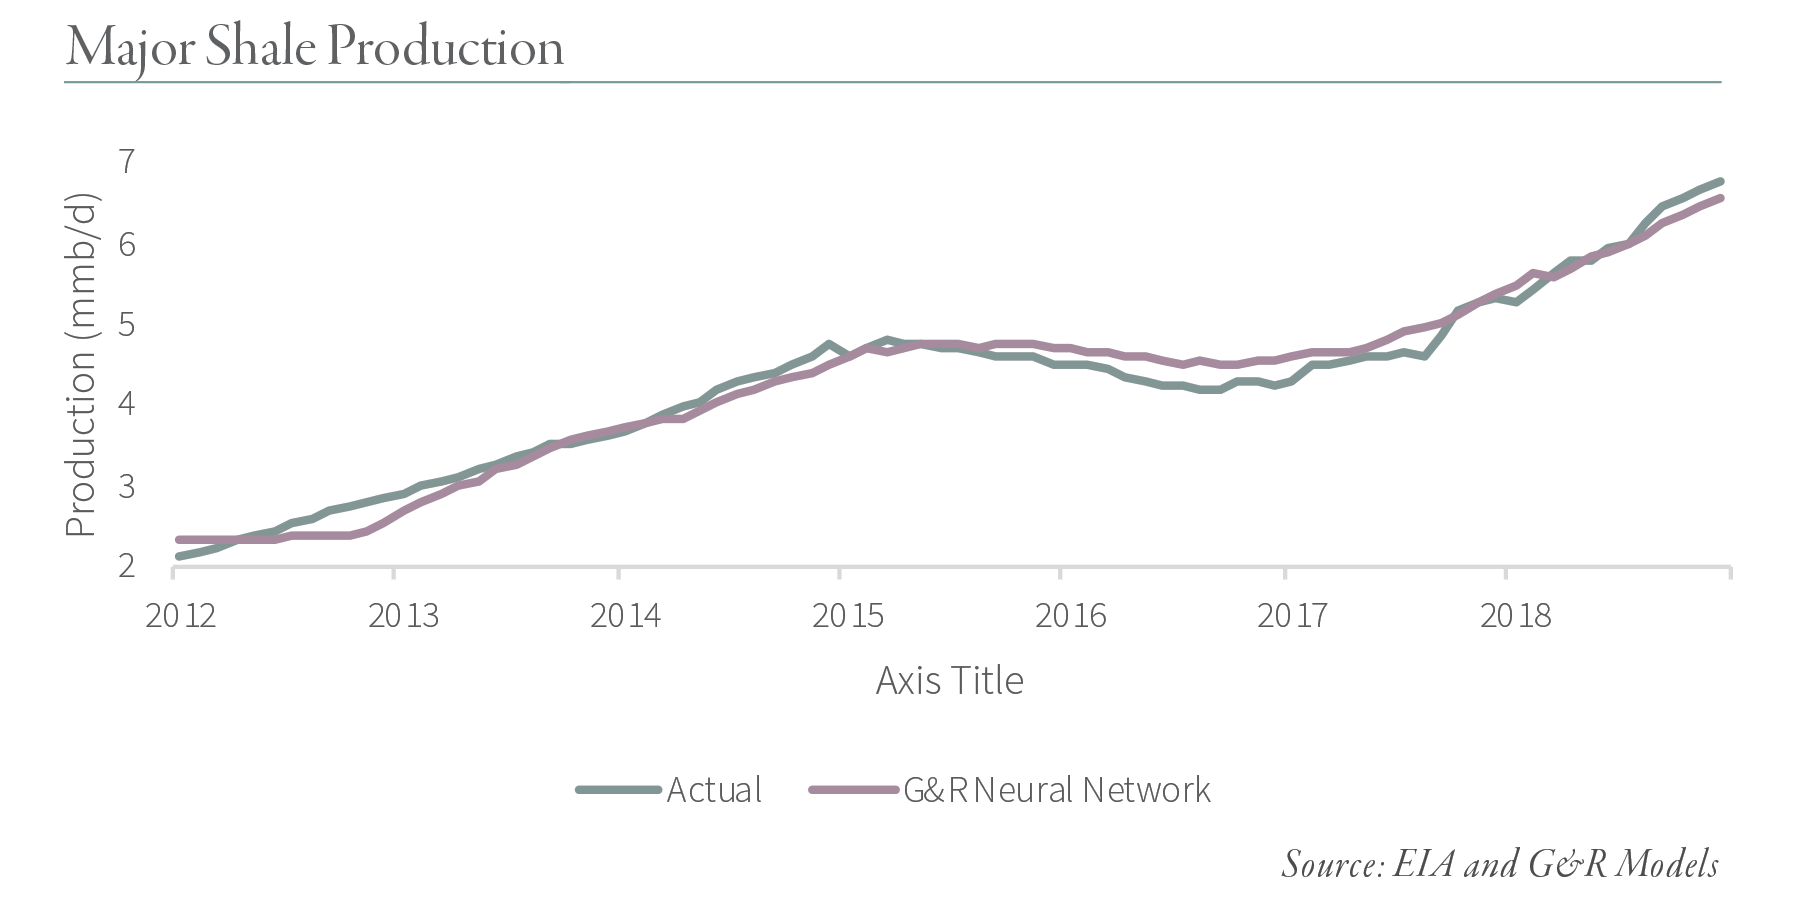
Applying our neural network historically, we can very accurately model production in the Eagle Ford, Bakken, and Permian using only a well’s location, lateral length and proppant size as inputs. In the following chart we have graphed historical production from these three basins against the predicted output from our neural network. As you can see, the results are excellent with an R2 in excess of 0.9.
Before we continue, we should point out that our new model largely confirmed our previous results. For example, we confirmed that a Tier 1 well is slightly more than twice as productive as a Tier 2 well in the Eagle Ford, Bakken, and Permian.

The critical question for global oil markets going forward is what level of growth we can expect from the major shale basins. We turned to our neural network for guidance. For each basin we modeled two scenarios. We used the average rig count over the last few months as our starting point (which may be too optimistic given we’re currently shedding rigs). Our base case assumes the current high-grading continues for as long as possible. For example, operators in the Eagle Ford will continue to drill 60% Tier 1 wells until they run out of inventory. Similarly, operators in the Bakken and Permian will drill ~70% and ~65% Tier 1 wells, respectively, for as long as possible. Our downside case assumes that future wells are drilled according to their remaining inventory. For example, of the remaining wells in the Eagle Ford, only 45% are Tier 1 and so future drilling will also be 45% Tier 1. For the Bakken this figure is 48% and 52% for the Permian. For each basin, we assumed that all future wells were drilled and completed using the most recent advanced techniques.
Under any scenario, future shale growth looks set to slow dramatically. In our past letters, we explained how we believed the Eagle Ford and Bakken would only grow moderately from here (if at all). Our neural network now confirms these views. Our base case (which assumes continued high grading) suggests the Eagle Ford can only grow another 380,000 b/d cumulatively over the next decade (or ~35,000 b/d per year) while our conservative case suggests the field will only grow by another 280,000 b/d (or 25,000 b/d per year). To put these figures into context, the Eagle Ford grew by 330,000 b/d on average each year between 2012 and 2015 and by 120,000 b/d in 2018.
Similarly, the Bakken can grow another 500,000 b/d cumulatively over the next 16 years (or ~35,000 b/d per year) before peaking under the base case. Under the conservative case, the Bakken will grow another 300,000 b/d over the next 23 years or 13,000 b/d per year. This compares with 250,000 b/d average annual growth in each of the last two years. As we have discussed previously, the Permian still has room to grow production. Under both scenarios, the Permian should grow production by another 2 m b/d before peaking around 6.5 m b/d sometime between 2029 and 2032. This explains why most of our E&P investments today are in the Permian basin. However, while this growth is impressive, it only represents growth of ~200,000 b/d per year, far below the ~700,000 b/d of yearly growth over the last two years.
In total, we expect the three major US shale basins will grow by another 2.7 to 2.9 m b/d in total before peaking around 10 m b/d sometime between 2027 and 2029. This equates to somewhere between 275,000 and 360,000 b/d of growth per year compared with nearly 1 m b/d of annual growth from the three basins each year between 2017 and 2019.
We should point out that these figures may be slightly higher in the early years and 2019 could actually see growth in excess of 700,000 b/d from January 1st to December 31st. However, we believe 2019 will be the last time growth exceeds 500,000 b/d as production starts to slow dramatically. Furthermore, we expect our projections are somewhat optimistic given that oil companies tend not to drill at an even pace until the entire drilling inventory is exhausted. Instead, drilling rates will likely taper as we progress through the next several years. As a result, the peak may occur further out in time but at a lower maximum level.
_______
This blog contains excerpts of our in-depth commentary, "The Gold Bull Market is Here". If you are interested in this subject, we encourage you to download the full commentary here.