
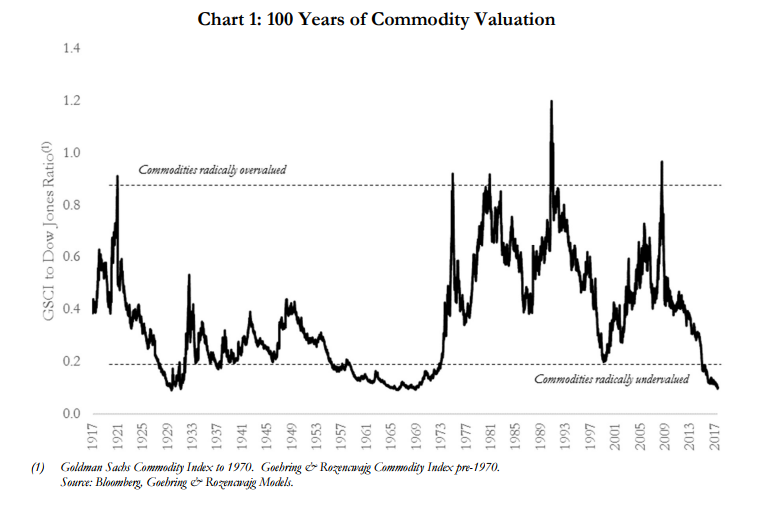
We are at the bottom in global commodity prices. As you can see from Chart 1 (which plots the price of commodities as measured against the US stock market going back 100 years), commodities are as cheap today as they have ever been. Only in the depths of the Great Depression and at the end of the dying Bretton Woods Gold Exchange Standard did commodities reach this level of undervaluation relative to equities. For those investors willing to ignore the noise and extreme negative commentary (regarding surging shale production, OPEC disunity, electric cars, and China’s impending collapse), there is a proverbial fortune to be made if they invest today. When commodities are this cheap relative to stocks, the returns accruing to commodity investors have been spectacular. For example, had an investor bought the Goldman Sachs Commodity Index (or something equivalent) in 1970, by 1974 he would have compounded his money at 50% per year. From 1970 to 1980 commodities compounded annually in price by 20%. If that same investor had bought commodities in 2000, he would have also compounded his money at 20% for the next 10 years (especially attractive considering the broad stock market indices return nothing over the same period).
But investors, both retail and institutional, have absolutely no interest in this radically undervalued asset class. Commodities are as cheap as they ever get relative to financial assets , and outsized returns await those willing to invest today, but nevertheless most investors still are not paying attention. In an age where everyone is obsessed with underperforming their benchmark, no one can take the risk of buying a declining or stagnant asset class— the safest bet is to stick with popular investment classes such as bonds and technology stocks.
Investors want comfort and proof that the turn is imminent and assured before they decide to invest. In the following commentary, we would like to make the case that the turn is likely here today and that, even if it is not, the future returns are so great that they are very much worth the wait. Last year, we believe commodities made their cycle-lows back in February in a spasm of panic selling before rallying strongly throughout 2016. Since January, oil prices have fallen back 20% from their highs while investors have become incredibly bearish—a situation not dissimilar to what happened back in 2001 at the beginning of the last great commodity bull market. After making its panic low of $11 per barrel back in the first quarter of 1999, oil prices rallied strongly (up 230%) over the next 18 months. After peaking at $37 per barrel in September of 2000, oil prices proceeded to pull back by over 50% in the next 12 months, in a wave of bearishness not unlike today. In retrospect, we know the selling spasm in oil (and all commodities) presented investors with an incredible buying opportunity. We believe the same opportunity is here for investors today.
Let’s go back and look at the two most recent periods when commodities were comparably “cheap” relative to stocks and discuss the backdrops that were in place, as well as the forces that ultimately broke the bearish psychology and caused commodity prices to enter into huge bull markets.
In the world of natural resources, we believe our crystal ball is better than average, but sometimes it is equally important (if not more so) to look back instead of forward in order to understand the forces at play today. So let’s turn the clocks back to 1970 to see what the financial landscape looked like as commodities made their bear market lows.
By 1970, the era of the gold (and gold-exchange) standard in the US was rapidly drawing to a close. For nearly 180 years, the US dollar had been defined by the weight and price of gold. For most of its existence, the US dollar was fixed such that one ounce of gold cost $20.67 before 1934 and $35 thereafter. The 1960s saw a huge economic boom that was vigorously stimulated by both the Vietnam War as well as the introduction of the Johnson administration’s War on Poverty and Great Society programs. The US decided that it wanted “guns and butter,” and robust credit creation was necessary to attain both. Money supply and bank credit grew strongly throughout the 1960s, and the US ran large chronic trade deficits. These deficits resulted in a huge quantity of US dollars accumulating on the foreign government’s central bank balance sheets. With the dollar pegged at $35 per ounce (a price that was perceived as undervalued) foreign governments (led by France) began to aggressively exchange their US dollars for ounces of gold beginning in the mid-1960s. Inflationary pressures had been strongly building throughout the US economy beginning in the early 1960s, but since everyone believed the US would continue to honor its $35 per ounce exchange privilege to foreign governments, inflationary pressures were extremely slow to spill over into commodity markets. Although it’s impossible to know precisely what international bankers and investors were thinking in 1971, by judging from the weakness in commodity prices, it is safe to assume they thought the US government would at some point severely contract money supply growth, raise taxes to run budget surpluses, and force the US economy into a severe, deflationary recession. In fact, William McChesney Martin, Federal Reserve Bank Chairman until 1970, threatened repeatedly throughout the 1960s to make good on his quote from a speech in 1955 to be “the chaperone who has ordered the punch bowl removed just when the party was really warming up.”
Except for the extraordinary 14-year period following the Civil War, the US dollar had always been defined in terms of gold, and the global financial community was extremely slow in believing that the US government would ever sever the link.
A great example of the “anchoring” influence of gold can be seen in the price action of copper during the 1960s. Even though the US experienced numerous copper shortages during the 1960s (brought about by the Vietnam War), by 1968, copper prices were still below their 1956 high of 42 cents. Oil prices exhibited similar behavior. Even in the face of incredibly strong global oil demand, oil prices in 1970 were only slightly higher than they were in 1957 (approximate $3.10 per barrel). In fact demand was so strong during that period, that global oil consumption actually grew by 8% per year between 1965 and 1970. In 1969 and 1970 oil consumption grew by almost 3.5 mm b/d year over year achieving all-time demand records that still stand today. Grain prices followed a similar path. For example a bushel of corn was priced at $1.50 per bushel in 1950 and by 1970 it averaged only $1.40. Wheat in 1950 averaged $1.90 per bushel and by the end of 1970 (after a big rally), it only hit $1.80 per bushel. The deflationary effect on commodities, brought about by the mistaken assumption that US governments would eventually be forced to significantly tighten both monetary and fiscal conditions to slow the run of gold from the US Treasury, caused commodities to become completely dislocated from their incredibly bullish underlying fundamentals. Although commodities languished in an undervalued state through much of the 1960s, by the end of the decade they had set themselves up for a massive bull move. This explains the first radical undervaluation of commodities since the end of the Great Depression (1970 on the chart above).
But for students of market history (and for those interested in the similarities with today), it is imperative to understand another very important development that took place in financial markets in the late 1960s. While the huge growth in money supply and bank credit in the 1960s bypassed commodity markets for the most part, it did find a very comfortable home in the stock market. By the late 1960s, a craze in growth-stock investing was about to grip financial markets. A group of approximately 50 high-quality growth stocks (the “Nifty Fifty”) were about to become institutional darlings and form the nexus of a stock market mania.
While the broad market reached a price-to-earnings ratio of 20 times in the early 1970s, the “Nifty Fifty” were gripped in a classic market bubble with their price-to-earnings ratio approaching 50.
For those investors prescient enough to recognize how radically undervalued commodities had become relative to stocks in 1970, it didn’t take long for their insights to be rewarded. In August 1971, President Nixon “closed the gold window” and in so doing ended the US pledge to exchange dollars for gold. The US was now free to print as much money as it pleased and to debase the US dollar to whatever level it felt appropriate. Overnight, commodity investors no longer needed to worry about a massive tightening of monetary and fiscal policy to protect the dollar’s value relative to gold and to foreign currencies. The closing of the “Gold Window” had an immediate impact on nearly every commodity. Gold prices surged by over four and half fold in just three years, while oil prices quadrupled, grain prices tripled, and copper prices doubled. For those interested in the plight of equities, the stock market peaked in the first week of 1973 and then proceeded to enter into a devastating two-year bear market. The stock market decline was led (not surprisingly) by the Nifty Fifty stocks, some of which fell by almost 90%.
For those investors willing to make commodity-related investments back in 1970, the returns were spectacular. From 1970 until 1980, the Goldman Sachs Commodity Index surged seven-fold versus a stock market that experienced a devastating bear market and which ultimately returned little. By the end of the decade, a true mania had developed in commodity markets, with many commodities becoming radically overvalued (1980 in the chart above) as investors started to believe (erroneously ) that natural resources had reached a perpetual state of shortage.
As is the norm with huge bull and bear markets alike, investment opinions often conform and align with the price action of the asset class, while important underlying trend changes are often missed. For example, as oil prices raced higher and higher, common wisdom believed that the world was “running out” and that demand would continue to exceed supply. However, at exactly the same time, the huge oil deposits in Alaska’s North Slope, the North Sea, and Western Siberia (all discovered in the late 1960s), were all about to start production. In an ironic twist that few foresaw at the time the world was about to be flooded with crude oil by 1980.
By 1979, the mania that had developed around commodities prevented investors from seeing the huge underlying supply and demand changes that had taken place. It was time to get out of commodities and back into stocks, which had gone through a devastating bear market, and had returned little for over a decade.
The great commodity bear market that stretched from 1980 to 2000 shattered the Club of Rome’s belief (developed in the 1970s) that natural resource markets had entered into a period of perpetual shortage. In fact, as the great 20-year commodity bear market unfolded, a new dogma was accepted that commodities would be in perpetual surplus. Huge investments in global mining and oil and gas projects in the 1970s combined with the introduction of new technologies (cyanide heap leaching in the gold industry, solvent extraction-electro winnowing [SX-EW] in the global copper industry and 3-D seismic imaging and sub-sea completion in the oil and gas industry) all contributed to the huge surge in commodity supply throughout the 1980s and 1990s. The break-up of the Former Soviet Union also contributed to the collapse of commodity prices during that period. (For a great essay on my research and opinion on the impact of the FSU implosion on global commodities market, please consult the book Mr. Market Miscalculates: The Bubble Years and Beyond by James Grant and look up the chapter titled “Thank Mother Russia”). The FSU was a huge commodity producer, much of which went into their industrial-military complex. As the economies of the FSU imploded post-1990, the FSU became a huge exporter of unneeded raw materials. This excess supply continued to depress commodity markets throughout the 1990s, and contributed to the widely-held belief by 1999 that commodity prices would never again recover.
The intense level of bearish commodity psychology caused by years of excess supply growth, severely exacerbated by dismantling of the FSU, had by 1999 produced another great investment opportunity (1999 on the chart above).
As opposed to the late 1960s (when the investment backdrop of the gold standard anchored commodity prices far below their equilibrium price levels), the buying opportunity of the late 1990s was caused by a combination of excess supply and rampant bearish investor psychology. With oil collapsing to $11 per barrel, and with copper at real price levels not seen since the Great Depression, it was hard to get bullish in the late 1990s. But for those who were willing to do serious research that tried to peer into the future, it was clear that new supply-and-demand trends were quietly emerging. These trends would ultimately force the great commodity bear market to end only a few years later. This time, it was the emergence of a huge new commodity buyer (China), combined with more than a decade of chronic underinvestment, that would cause the next massive commodity bull market to unfold.
At the same time, critical developments in the stock market were taking place. After the Savings and Loan crisis of the early 1990s, the 1997 Asian currency crisis, and the 1998 collapse of Long-Term Capital Management, the US Federal Reserve throughout the 1990s had allowed for rapid growth in all of its monetary aggregates. In a repeat of the 1960s, the majority of this newly created money avoided commodities altogether and instead again found a comfortable home in the stock market.
As we mentioned, the commodity bear market in the 1960s and early 1970s had occurred alongside an overvalued stock market embodied by a new “craze” that revolved around the “Nifty Fifty.” In an interesting similarity, the great commodity bear market of the 1990s occurred alongside one of the most over-valued markets in US history that revolved around a full-blown market bubble in technology and internet stocks.
We believe it’s important to highlight that both periods of extremely depressed commodities prices (1970 and 2000), were accompanied by overvalued equity markets and related investment bubbles—a situation that exists once again today.
By the end of 1998, oil plunged to its $11 per barrel lows (a price last seen in 1986) while the internet stock market bubble had begun to form. By 1999, oil had quietly slipped into a bull market (although it would take another four years before anyone acknowledged it as such) and by the summer of 2000, the tech/internet bubble had begun to break. The great commodity bull market of the last decade had quietly taken off. Just like in 1970, if an investor had chosen to invest in commodities in 1999, the payoff would have been huge. From 1999 to 2010, commodities (as measured by the Goldman Sachs Commodity Index) retuned almost six-fold while the stock market returned almost nothing.
And so here we are today. After six years of declining commodity prices (brought about by shale related surges in oil and gas production, rapidly rising grain yields, and the massive expansion in certain parts of the mining industry— primarily iron ore), and nearly eight years of a rising equity market, commodities today are now priced as cheap relative to stocks as they’ve ever been, as the chart above clearly shows.
While it is obvious that commodities are cheap today, the most pressing question facing a commodity investor is what will ultimately make them expensive. If removing the anchoring effect of the Gold-Exchange Standard allowed commodity prices to explode in the early 1970s and supply disappointments and strong Chinese demand forced commodity prices higher in the 2000 to 2010 cycle, what forces will drive commodity prices up from their depressed levels in this next cycle?
We are research driven and, as we have often written, we believe that our research uncovers inflection points and trend changes sooner than the consensus opinion. As we mentioned earlier, while our crystal ball sometimes becomes cloudy, we believe that our research more often than not gives us insight into trend changes that most investors usually miss.
What does this research tell us today? First, as we have mentioned over and over again, we believe that global commodity demand will continue to surprise strongly to the upside. Over the last 17 years, commodity-demand surprises have come primarily from China. Our modelling tells us that these upside surprises are far from over, especially with regards to oil, natural gas, copper, and agricultural commodities.
However, a new source of demand is about to emerge that few (if any) analysts mention: India. The same research and modelling that correctly predicted the rise of China early last decade now tells us India today is rapidly approaching its “tipping point” of rapidly accelerating commodity consumption. In fact, our research leads us to believe that India today is precisely where China was back in the early part of last decade. (For a further discussion of the China-India parallel, please read the “Global Oil Market” section of this letter.) And remember, the world has never before had two major countries (each with populations exceeding 1.3 billion) that are simultaneously in the middle (China) and just entering (India) their periods of intense commodity consumption growth. From the late 1960s until the early part of last decade, we calculate the world had approximately 500- 750 million people residing in emerging market economies that are in their period of high intensity commodity consumption at any given time. However, with India now joining China and the rest of the South-East Asian countries, we calculate that over four billion people have now entered into what we call the middle of their “S-Curves” – that is, the period where commodity consumption intensity rapidly increases. All of today’s headlines discuss potential weakness in future commodity consumption. However, we believe just the opposite is now unfolding. We are now entering into a period of pronounced, prolonged acceleration in global commodity demand.
Second, our models tell us that supply disappointments loom in many commodities while the conventional consensus opinion believes that supply will continue to surge. The global oil market presents a great example of the discrepancy between consensus belief and reality. For the second year in a row, new conventional oil discoveries have contracted to almost nothing. As we have written extensively in the past, for the first time ever (even including all of the reserve revisions), we are now shrinking our reserve base of conventional oil. Although the International Energy Agency (IEA) predicts large increases in non-OPEC oil outside of the US next year and beyond, our modelling tells us that non-OPEC oil supply outside of the US will severely disappoint -- an opinion that oil service companies such as Halliburton strongly agree with.
Chart 2: Halliburton Global Market Fundamentals
Source: Halliburton Presentation.
Furthermore, as we have discussed at length in these letters, we believe the US shale revolution will not be exportable to the rest of the world, with the exception of three plays (please see our 3rd Q 2016 letter for a detailed analysis). We have reached a bizarre point in global oil supply. For the next several years, the only source of incremental oil supply growth could very well come from just six counties in West Texas. Given our belief that global oil demand will continue to vastly exceed expectations, we ultimately believe these six counties will simply not be able to meet the growth needs of the entire world.
Finally, in a strange parallel with both 1970 and 2000, a very richly-valued equity market and a related investment mania are once again taking place at the same time as a great commodity bear market. Back in the 1960s and the 1990s, the Federal Reserve ran very loose monetary policies and very little (if any) of that newly created credit wound up in commodity markets. Both prior periods experienced extreme stock market overvaluation and both periods had distinct market bubbles. Over the last seven years, the Federal Reserve, through its three rounds of “quantitative easing” has run the loosest monetary policy ever experienced and, just like what happened back in the 1960s and 1990s, very little (if any) of that money wound up invested in commodity markets. With the general stock market priced at 20-times earnings and with the intense speculation now taking place in the “FANG” stocks , we have yet another data point suggesting we have replicated the set up to both the 1970 and 2000 experiences. Back in 1970, the investment mania surrounded the “Nifty Fifty” while the 2000 mania surrounded the internet. Today’s mania surrounds social media and big data. Although there is no explicit reason why a commodity bear market bottom should coincide with a speculative stock market top, the fact remains that it happened twice before, and history suggests it’s about to happen again—another data point suggesting that today’s commodity bear market is rapidly drawing to a close.
Please study the chart at the top of this essay. At current levels, an investor has an opportunity to profit in commodities that comes only once in an investment lifetime. Everything has been set up, and yet few (if any) have made the investment. Spectacular returns await the few who do.
Market Commentary
Intense pessimism regarding oil prices dominated global resource markets in the 2nd Quarter. Continued talk from the Fed about both future interest rate hikes and balance sheet reductions rattled resource investors. The S&P North American Natural Resource Sector Index, which has a high weighting to the North American oil and gas stocks, declined by 7.2% during the second quarter. For the year the Index is down 11.2%.
Reflecting, the relative outperformance of mining versus energy this year, the S&P Global Natural Resource Index, with its much higher mining and agricultural weightings, continued to outperform its North American peer. For the 2nd Quarter, the S&P Global Natural Resource Index declined only 1.0%. For the full year, the Index is actually up 2.5%. In comparison, the overall market as measured by the S&P 500 stock index rose by 2.6% during the quarter. For the year, the S&P 500 is up a robust 7.5%.
Oil was the worst performing commodity during the 2nd Quarter, falling over 9.5%. Exploration and production and oil service stocks were particularly hard hit. For example, the S&P E&P index fell over 14% during the quarter. For the year, E&P stocks are down over 22%. Oil service stocks (as measured by the Philadelphia Oil Service Sector Index) fell 22% during the quarter and are now down 28% for the year. As we will discuss extensively in the oil section of this letter, we believe investors are not properly appreciating the dynamics in global oil markets today. For reasons that we do not agree with, investors believe that global oil balances have loosened considerably since the beginning of 2017. We believe instead that oil markets have tightened almost exactly as we outlined back in our 4th Q 2016 and 1st Q 2017 letters.
Although investing in energy over the last six months has been painful, we believe that global oil market balances have rapidly tightened. The present weakness in energy and energy-related equities represents a huge buying opportunity for those investors with small energy exposure. Investors are now registering maximum pessimism and the underlying fundamentals have improved just as we outlined six months ago. The last time we saw such a wide divergence between reality and perception was back in the 4th Q of 2001, when oil hit $17 (on its way to $145, we might add). We will discuss all of the fundamental oil data in the oil section of this letter.
Outside of energy, base metals were mixed. Aluminum, zinc, and nickel were all down between 2% and 6% during the quarter. The standout was copper which rose by almost 2% during the same period. As we have outlined in these letters, we believe investor perception regarding global copper markets are rapidly changing. Last year, almost every metals analysts thought the global copper market would be in structural surplus for years and years to come. Recent data has now forced many of these copper analysts to change their stances. Please read the copper section of this letter where we outline our belief that copper and copper-related equities will continue to be great investments in the next several years. Copper equities, responding to all of the Fed talk regarding tightening, were weak during the 2nd Q (copper stocks as measured by the Global X Copper Miners ETF fell by 7.0% during the quarter) and we used that weakness as an opportunity to add to our copper equities.
Precious metals were weak overall during the quarter. Gold fell less than 1%. Silver however, showed pronounced weakness, falling by almost 10% during the quarter. Responding to the increased pressure to reduce the production of diesel-powered cars in Europe (platinum dependent) and the continued strong gasoline car sales in China (palladium dependent), platinum prices were weak (down over 2%) while palladium prices were strong (up almost 6%). Gold stocks followed the gold and silver prices and were down 3.2% during the quarter. For the year however, gold stocks are still up over 5%.
After showing pronounced strength in the 1st Quarter, physical accumulation of gold by western investors, as measured by the physical gold ETF’s, turned negative in the 2nd Quarter. However, physical gold accumulation by both China and India soared in the 2nd Quarter and absorbed most, if not all of the western physical liquidation. As we have written in previous letters, we believe that history is now repeating itself and that if the Fed continues to raise interest rates and ultimately shrinks its balance sheet, the US dollar will continue to weaken (counterintuitively). Fitting this pattern, the Fed has raised rates twice so far this year and the dollar has now declined by over 7%. The Fed has indicated that it will raise rates again later this year and that it is preparing to shrink its balance sheet. We strongly believe that both of these events will put significant additional downward pressure on the US dollar. As the dollar continues to weaken, we believe western investors will aggressively return to the physical gold markets. We recommend investors maintain present positions in the gold and silver stocks.
And finally, after four years of a grinding bear market, global grain markets appear to be showing signs of life. Huge speculative short positions ran into adverse weather conditions which has finally stirred investor interest. Wheat prices were particularly strong. Record low wheat plantings in the US combined with extremely dry European weather has produced a surge in wheat prices of 20% during the 2nd Quarter and 25% for the year.
As we have written about in previous letters, global grain demand remains incredibly strong (the same “S-curve” effect that has impacted the global oil markets also significantly impacts global protein markets -- a subject we have researched and discussed at length). If we have any pullback in global grain yields (especially in soybeans), we could see global inventories swing from huge excesses to record lows very quickly. Given the above normal temperatures in the US Midwest over the last several weeks, the risk of lower-than-expected yields has increased. We are monitoring global weather conditions very closely. We ultimately believe that depressed grain prices combined with low valuations in many agricultural stocks has created the potential for an explosive move in grain prices that has made investments in the agricultural industry attractive. Accordingly, we have increased our exposure to the agriculture-related stocks.