“If production were to average 80.5 mm b/d, then global inventories would go from ‘full’ to 15-year low levels in only two months.”
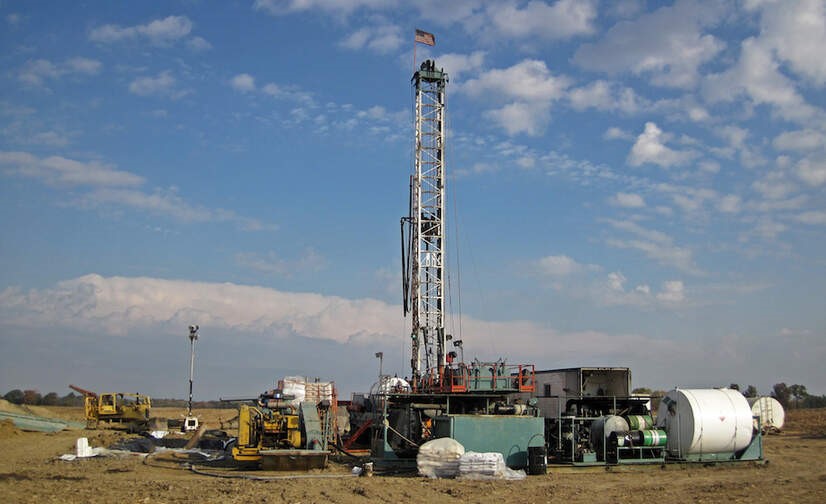
Image Source: desmogblog.com
In recent blogs we’ve been discussing how OPEC+ cuts coupled with “involuntary” cuts from U.S. shale producers will dramatically limit available supply when demand normalizes. However, there is another element that will also affect future oil supply: the huge retrenchment in drilling activity taking place today.
The US oil rig count has fallen 45% in the last six weeks alone and our models suggest these declines will continue. Of the publicly traded companies we follow, capital spending has been cut by 40% on average so far with many companies now announcing a second round of cuts. In total, we estimate that the US oil rig count will fall by nearly 75% from 2019 levels. Our proprietary neural network tells us that US production will decline sharply by 2.1 mm b/d as we progress throughout 2020 based on these drilling assumptions (before considering any shut-ins). In other words, based upon capital spending guidance, new production would not nearly be enough to offset natural field declines from aging wells. This phenomenon would then continue into 2021 unless drilling activity were sharply increased later this year (something we think is unlikely).
In the rest of the non-OPEC world, several final investment decisions (FIDs) have already been postponed or rejected on long lead-time projects, making it a near certainty that production from this group will decline well into the 2020s. Summer maintenance programs in the North Sea will likely be deferred as well, saving near-term cash at the expense of production.
Together with the shut-ins discussed above, attrition from lower drilling expenditures and deferred maintenance could cause production to fall to 80.5 mm b/d by the end of 2020.
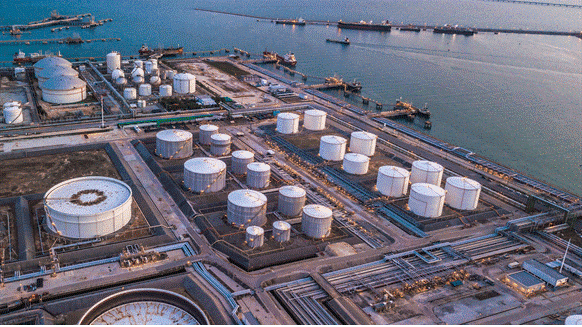 Image Source: rigzone.com
As demand normalizes, today’s large inventory overhang will be worked off much faster than anyone realizes. For example, “full” crude storage is approximately 3.5 bn bbl while the 15-year low level is 2.5 bn bbl. In the oil section of our Q1 2020 letter we discuss demand drivers in depth, but for now assume that demand normalizes slowly over the year eventually reaching 95 mm b/d by year end. While this sounds optimistic, we should point out this projection assumes demand would still be lower year-on-year by 5 mm b/d by year end (a conservative estimate). If production were to average 80.5 mm b/d, then global inventories would go from “full” to 15-year low levels in only two months. Even if OPEC+ fully reversed their production cuts, inventories would go from full to dangerously low in just under five months.
However, the reality in 2021 may be even more dramatic. Demand will likely continue to normalize, adding the remaining lost 5 mm b/d to regain the 100 mm b/d level. At the same time, the shales will continue to decline well into 2021, opening the gap between supply and demand to well over 10 mm b/d sometime next year.
Interested in reading more on this topic? Download our Q1 2020 Research, Oil Supply is About to Collapse, where we explore this subject and many others.