
The shale gas revolution began in earnest in 2005. Even though the shales were being aggressively developed, shale gas production in 2010 still represented only 20% of US supply. Of the 21 trillion cubic feet (tcf) of dry gas produced in 2010 (or 58 billion cubic feet per day [bcf/d]), 80% was still produced from conventional reserves. Shale gas production in 2010 remained concentrated in two basins: 40% of total shale production came from the Barnett; 30% came from Haynesville.
Today, US dry gas production has surged to over 90 bcf/d and the contributions from shales and conventional sources have flipped. The shales now represent almost 80% of total US dry gas production (70 bcf /day) while conventional gas production represents just a little over 20%. The contributions from various basins have also shifted significantly over the last nine years. The Barnett and Haynesville have gone from representing 65% of US natural shale gas production in 2010 to only 12% today. The largest source of gas supply growth by far over the last nine years has come from the Marcellus shale. Today the Marcellus produces 22.5 bcf/d, representing almost 25% of total US dry gas supply, making it the largest basin in the country by a wide margin. You cannot overstate the importance of the Marcellus to the US gas market.
As we mentioned in the Natural Resource Market section of our Q3 letter, we have spent much time over the last five years trying to better understand when the grinding North American natural gas bear market might end. We are seeing an extremely interesting data point emerge in the Marcellus shale (as well as the Hayneville, the second largest gas field in the US) that could provide an answer. While we do not believe the natural gas bear market is gas is yet over, this potentially bullish trend must be closely monitored. These trends may provide investors the signal that the great gas bear market is now entering its final innings.
Back in November 2016, we were the luncheon speakers at the Doyle Trading Consultants’ annual fall conference. Although the event was a coal conference, we spoke on the future of North American natural gas and whether there was any hope that the bear market, then in its ninth year, might be drawing to a close. Absent a short-term weather-related spike, we offered little evidence that the bear market was nearing an end. We explained how supply growth would continue to exceed demand growth even given the coming build-out of US LNG export facilities.
However, we did mention at the very end of our presentation that any bullish long-term thesis would need to revolve around one issue that few investors were discussing. A shale field (whether it be gas or oil) has many of the same characteristics as a conventional field. In conventional oil and gas fields, production typically peaks and then declines once half of the recoverable reserves have been produced. This principle was first put forward by the famous and controversial geologist King Hubbert in the 1940s. Although petroleum geologists and engineers debate the underlying drivers, the empirical evidence is hard to refute and the principal is largely accepted as fact today. For those trying to pick the end of the natural gas bear market, one had to determine when the Marcellus gas field would peak and then decline.
The difficulty in applying Hubbert’s theories revolves around estimating a field’s total recoverable reserves. The relentless advancement of technology has pushed recovery factors constantly higher across almost all oil and gas fields. This in turn has led to rising recoverable reserve estimates. In our previous letters, we used Hubbert’s theories to make several predictions, some of which have been right and some of which have been wrong. For example, we correctly estimated when the giant Saudi Ghawar field would roll over. However, we were too early in claiming that the Bakken and Eagle Ford had peaked. Our Q3 2016 letter discusses Hubbert and his theories, including all the drawbacks and limitations.
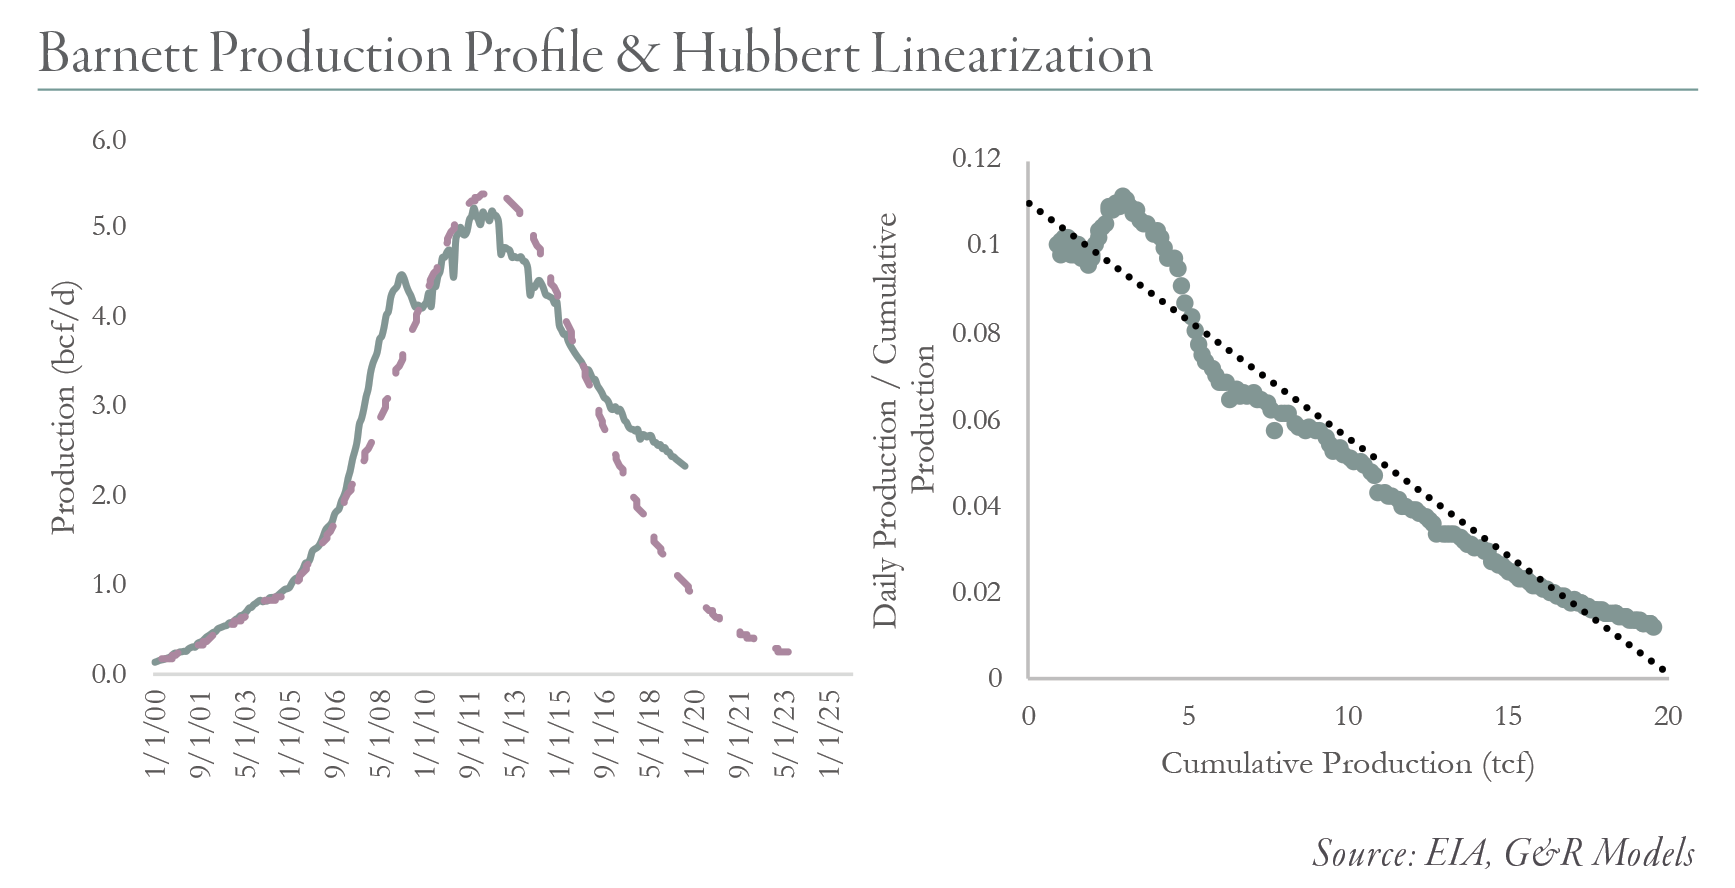
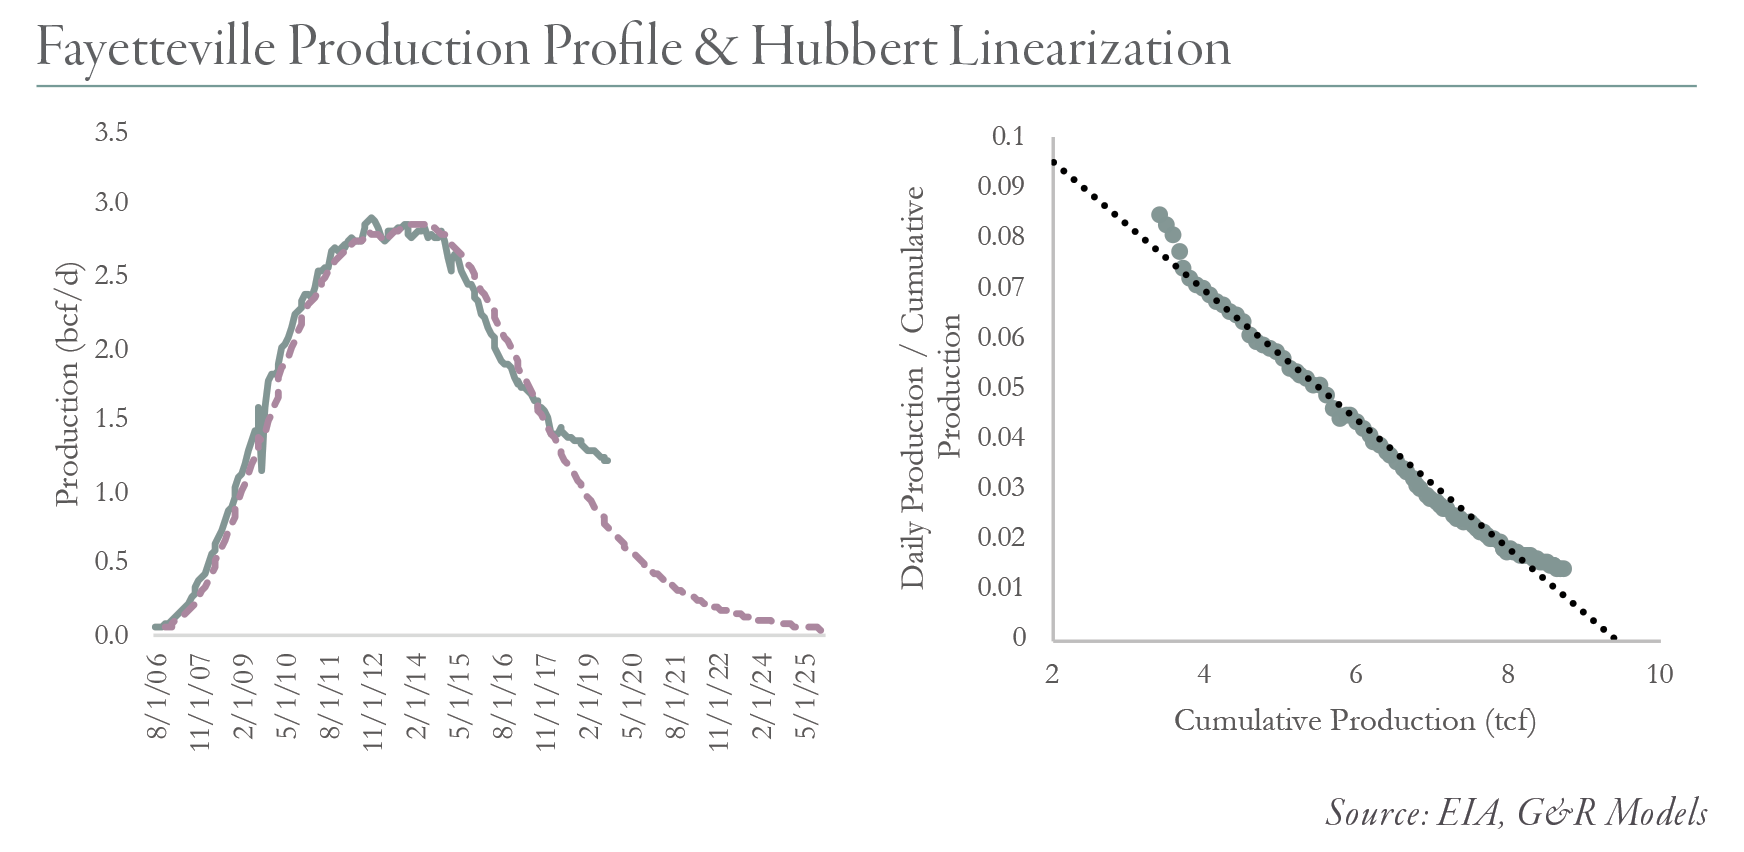
Hubbert’s theories are controversial, but natural gas production from two of the three oldest gas shales, the Barnett and the Fayetteville, has long since rolled-over, and the production profiles from both fields are now tracing out near-perfect “Hubbert Curves.”
The third field, the Haynesville, highlights one of the major problems with Hubbert’s theories. The Haynesville first produced significant quantities of gas in 2009. By 2012, production had surged to over 7 bcf/day and represented 10% of total US supply. Production peaked unexpectedly and by early 2016 had fallen by half as the economic parts of the field were drilled up. Many natural gas investors (including ourselves), thought the Haynesville would continue to decline. However, by 2016 Haynesville operators had significantly increased both the lateral lengths and proppant loadings of their wells with tremendous positive results. By 2017 production once again started to strongly grow. Today, production has reached new highs at nearly 9 bcf/d. The productivity improvements associated with longer laterals, larger proppant loadings, and more frac stages significantly increased the ultimate recovery of the field.
With the Marcellus, if we can predict when gas production from the field peaks, it could be extremely important data in determining when the gas bear market might end.
Next week, we will turn to our newly designed neural network for answers. However, if you’d prefer to continue reading now, please download the full-length research piece below, What Is Happening to US Shale Production.
