
“Brace for another steep and sudden drop in Oil Prices”
- Commodities Column, Barrons, August 14, 2017
“BHP chairman say $20 billion investments in shale was a mistake.”
- Reuters, June 29, 2017
“A Commodity Superpower Asks What if India Turns Out Like China?”
- Bloomberg News, October 5, 2017
We have so much to discuss in this letter that it’s hard to know where to start. Global oil inventories continue to draw rapidly and we have now reached the point where further drawdowns will put severe upward pressure on prices. Oil production from the US shales has slowed significantly in the last six months, taking the energy analytic community by complete surprise, and evidence continues to emerge suggesting India is now entering its period of accelerated commodity consumption (a subject we discussed at length in our last letter).
Each makes for a great story and, we will cover these topics in depth. But first, it is imperative to discuss the inventory situation today and its historical impact on oil prices. We are being presented with the buying opportunity of a lifetime and we want you to clearly understand the reasons why.
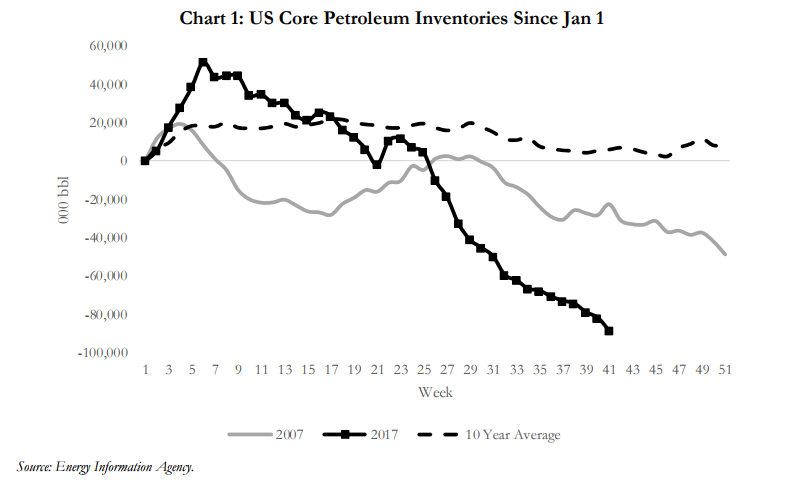
Despite continued rampant bearishness, global oil demand continues to significantly exceed supply and global inventories are now drawing at record rates. Back in January, our models told us the energy analytic community was significantly underestimating demand. We wrote, “the world oil markets will end up severely under-supplied by over 600,000 b/d during 2017.” At the time, few in the energy analytic community agreed with anything we wrote. However, a funny has happened as 2017 has progressed. After a brief build in January and February, oil and product inventories (both here in the US and globally) have in fact drawn down by 500,000 b/d since March – very much in line with what we predicted. As Chart 1 vividly shows, we are now drawing down global inventories at the fastest rate ever experienced. Readers of our letters will be familiar with the drivers of this rapid drawdown: global oil demand is surging, while non-OPEC oil supply (both here in the US and abroad) is disappointing (subjects we have extensively discussed in previous letters).
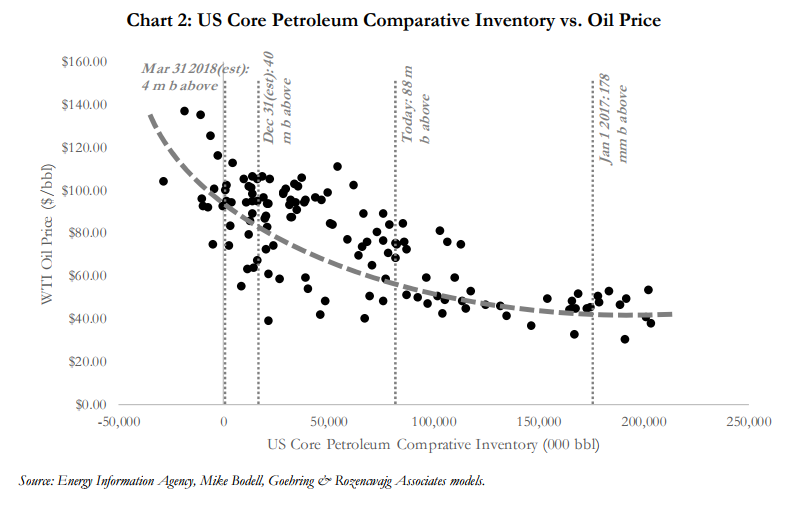
But now another important point has emerged in our oil bull market journey that must be highlighted. As demonstrated by the energy analyst Mike Bodell on Chart 2, the inventories have now drawn down to critical points where further inventory reductions will result in severe upward price pressure. As you can easily see from our modeling, we have marked where inventories will stand by both year end and by the first quarter of 2018. If our inventory extrapolation is correct and inventories reach these levels (and they should—our modeling has been correct over the past nine months), then prices have historically surpassed $100 per barrel.
In our January letter, we went into great detail about our belief that OPEC, relying on faulty International Energy Agency (IEA) data, was repeating the same mistake it made back in 2006. For those who don’t remember what happened in 2006, OPEC cut production into an oil market that had quietly slipped into deficit and thereby over-tightened global oil markets. A price spike to $150 per barrel in the summer of 2008 was the result. Although inventories started at a much higher level this year compared to 2006, inventory draws since the 2016 OPEC production cuts have been nearly four times larger than what we experienced back in 2007 and 2008. Our models tell us that global inventories will continue to draw and we run the risk of a huge upward move in prices starting right now. The same “roadmap” that told us we were repeating the 2006 OPEC production cut mistake, is telling us now that we are travelling down the exact same road. Please read the “Oil Section” of this letter where we were will discuss all the supply and demand issues that are unfolding right now in today’s global oil markets.
The second important issue cropping up since our last letter has been the abrupt slowdown in production growth from the US oil shales. Most oil analysts at the start of 2017 believed US crude production would grow by approximately one million barrels per day between January 1st and December 31st. That level of growth would imply full-year 2017 oil production of 9.3 million barrels per day or 450,000 b/d above 2016 levels. Factoring in NGL growth of ~200,000 b/d would leave total US crude and NGL production growth at ~650,000 b/d. As recently as July, the IEA echoed these views, calling for total US 2017 production (i.e., oil and NGL’s) to grow by 610,000 b/d compared to 2016. Many analysts felt these estimates would ultimately be revised higher.
Even with substantial OPEC production cuts, the energy analytic community has vigorously argued that because of strong US shale oil growth, global oil markets would remain in long-term structural surplus. We have long argued that even with strong production growth from the US shales, the oil markets would remain undersupplied by as much as one million barrels per day as 2017 progressed, given the OPEC production cuts and our non-consensus estimates for strong global demand growth.
However, data has now emerged suggesting that US crude production growth is rapidly slowing. We first noticed this trend in the beginning of June and we made a brief reference to it in our 2nd Q letter released July 21st when we wrote: “now recent data indicates the US shales have slowed their growth dramatically, which confirms our models.”
Between September 2016 and February 2017, US crude production grew by 100,000 barrels per day per month, but since then US production has ground to a near standstill. Between February and July, US production has only grown by 33,000 barrels per day per month – a slowdown of 67%. Moreover, preliminary weekly data for August and September (adjusted for the impact of Hurricanes Harvey and Irma) suggest that production growth has slowed even more. Part of this slowdown is the result of the Gulf of Mexico which went from adding 50,000 b/d per month between September and February to being largely flat between February and July. However, onshore production growth has slowed by nearly 45% over that time as well (from 54,000 b/d per month to 30,000 b/d per month).
The slowdown in US onshore production growth is even more puzzling given the huge increase in drilling that took place over that time. The Baker Hughes oil rig count is up 130% since bottoming in May of last year. In spite of a surging rig-count, onshore production growth is now showing signs of significant deceleration.
Although it is still early in the production history of the shales, it now appears the growth in US shale production may not be nearly as robust as originally expected. If our observations and analysis are correct, then the oil market will be even more under-supplied that we expected in the 4th Q of the year and incredibly undersupplied into 2018. The ramifications are going to be huge.
In the oil section of this letter we will try to answer the question of why US oil-shale production is now slowing. As of today, we have seen little in the way of analysis that attempts to explain what is quickly becoming the most pressing issue facing global non-OPEC oil supply. We believe there are two main explanations. First, based upon our field-by-field analysis, we believe that many of the US shale fields (particularly the Eagle Ford and Bakken) are showing early signs of exhaustion. Most of the top-tier acreage in the plays have been developed and, as producers are forced to move into the second- and third-tier drilling inventory, production growth will be harder to come by. Second, we believe that last year’s production data benefitted from a one-time surge due to the development of a large number of drilled-but-uncompleted wells (DUCs). These wells were brought on in the second half of last year and boosted production. Analysts then extrapolated this level of production growth into 2017 without realizing that it was a one-time surge in production.
The unexpected slowdown in US shale production is clearly shown in E&P company’s 2nd Q reported results. We constructed an index of 67 publicly traded US companies. While not all of these companies’ production is exclusively in the US, the majority of it is. In aggregate, these companies produced 4.0 mm b/d in the first quarter. If we assume that 85% of the total production is US based, then our survey represents approximately 40% of US crude oil production. Incredibly, nearly 70% of these 67 companies missed their consensus estimate for 2nd Q oil production. In total, the group was expected to grow by 150,000 b/d sequentially but instead only grew by 56,000 b/d – 62% below expectations. Moreover, 12% missed production estimates by over 10%.
Furthermore, we have seen several companies lower their full-year 2017 production guidance. We believe that more reductions are coming. Of the companies that we track, 14% have reduced their 2017 production guidance. In aggregate, these companies had guided to 67,000 b/d of oil production growth at the start of the year and have since reduced this figure by 40% to 42,000 b/d today. Our analysis tells us these reductions are only the beginning. In a very interesting development, another 20% of our survey have left their production guidance unchanged, but have increased their capital spending guidance by 10%. In other words, they will need to spend more than expected to reach the same level of production growth they had anticipated only a few months ago. Since most drilling and completion costs were likely locked in when guidance was set earlier this year, these revisions suggest that many companies are not seeing the drilling productivity they had originally expected. We believe we will continue to see additional production guidance reduction from many of these companies.
These two incremental data points (2nd Q production estimates coming up short and full-year production guidance being lowered) suggests to us that most analysts (and indeed many companies) did not expect the current slow-down in oil production growth. This raises a very interesting question--and one that we will try to address in the oil section of this letter: Are the shales as big and robust as generally believed, or are we over-estimating the ultimate recovered reserves of the shales and thereby their peak production rates? This is a very difficult question to answer; however in this letter, we will analyze the various shale basins in the United States using a reserve estimation technique called “Hubbert Linearization
Using Hubbert Linearization (a technique used to estimate the inputs used in a Hubbert Curve), our models tell us the energy analytic community is over-estimating ultimate recoverable reserves of the US shale oil plays by a factor of nearly 50%. This study has profound implications. First, it suggests that future production from the shale oil plays in the US could be much smaller than most people believe. Second, it could explain why shale production has already started to disappoint over the last six months. Last, it suggests that we are unlikely to repeat the level of production growth we have experienced over the last five years. In fact, according to our Hubbert Linearization, total US oil production may only grow at a fraction of the level we have seen over the last several years. This last point is particularly important because most analysts believe that US shale production will surge as soon as oil prices advance above $50 per barrel. Our analysis leads us to believe this is a very unlikely outcome.
The US shale oil plays are the only remaining source of material non-OPEC supply growth in analysts’ models -- conventional oil discoveries are at an all-time low. If we are ultimately unable to grow shale production, then global oil supply is at risk of falling far short of strong demand growth going forward. Please read the oil section for a full description of our analysis. It’s all original research, and the investment implications, both short term, and long term, are huge.
Since we wrote in our last letter that India’s growth in commodity consumption is on the verge of substantial acceleration, numerous data points have emerged confirming our theory. Many analysts believe, because of structural and cultural problems, India would never be able replicate China’s growth over the last 25 years, that India would “never be China.” We have never believed this, although our models told that India’s period of accelerated commodity demand (the “S-Curve” tipping point) was still a number of years away . However, our models are now beginning to tell us India is today where China was back in the early part of last decade, and that going forward India will surprise materially to the upside in terms of demand, just like China starting doing 17 years ago. It’s important to note the surprises have already started. For example, in a series of recent revisions, the IEA has made huge upward revisions in India’s oil demand for the last several years —revisions that almost no India or oil analysts have commented on. The oil section of this letter will discuss the size and importance of these revisions. Given the supply constraints we have just talked about in global oil markets, as well as continuing strength from other sources of non-OECD demand and pervasive market bearishness, we believe we are on the verge of a once-in-a-career inflection point in global oil markets.
Market Commentary
Commodity prices and natural resource stocks rebounded in the 3rd Q. Much stronger than expected growth from China and continued economic strength from the rest of the emerging markets forced short covering and raised some interest from the investment community. Continued weakness in the US dollar also helped commodity prices. As measured by the DXY index, the dollar fell 5% in July and August before rebounding in September. For the quarter, the dollar slipped over 2.7%. Leading the commodity rebound were the base metals. Copper, aluminum, and nickel were up approximately 10% during the quarter. Zinc, reflecting continued supply constraints, was the strongest base metal—up over 15%. For the year, the base metals have been among the best performing commodities. For example, copper, aluminum, and zinc have appreciated between 20% and 25%. Copper remains our favorite investment in the base metals. Last year we wrote extensively about copper and the impact the electric vehicle would have on global copper demand. At the time we wrote that letter, few understood how much copper is required to build out and generate electricity from renewable sources. Today, this fact is becoming more widely recognized. In a widely read interview given at the end of September, the Chief Commercial Office of BHP called copper “the metal of the future.” He argued that the biggest impact from the growth of electric cars will be on copper.
As we have outlined many times in these letters, copper demand in the next 10 years is going to surge, resulting in much higher copper prices. Copper equites rose strongly during the quarter (up 20%), but we believe the copper bull market is just starting. The copper bull market will play out over many years. Copper remains our favorite investment metal.
Global coal markets also performed well during the quarter, driven by continued economic strength in China and a rebound in steel production. Metallurgical coal prices rose a strong 30% during the quarter and global thermal prices rose almost 25%. We find the sector particularly attractive for two reasons. Since most of the industry slid into bankruptcy over the last five years, US coal equities are now very cheap. The US Department of Energy is proposing new rules allowing utilities, including coal plants, to cover certain costs related to base-load capacity. The purpose of the rule is to maintain a certain level of base-load capacity to back up an electrical grid made increasing unstable by renewables. This would potentially slow the retirement of existing coal plants. As long as gas prices remain depressed, we do not see a bull market developing in coal. However, we believe the super-depressed valuations of the stocks make these equities potentially rewarding investments.
Oil prices rebounded in the 3rd Q. WTI rose 12% and Brent prices rose almost 20%. Although large amounts of US oil data was distorted by impacts of Hurricane Harvey, which knocked out almost 25% of the US’s refining capacity at the end of August, certain strong trends continue. Global oil demand is surging (a subject that we have discussed at length over the last year) and it now looks like production from the US shales is slowing. Both US and global inventories are now drawing at approximately 500,000 b/d—a figure very much in line with what our models told us back in January. As discussed in the introduction of this letter, we believe that we are now at the point in the relationship between inventories and price where further inventory drawdowns, something our modelling tells us to expect, will put significant upward pressure on prices.
We remain extremely bullish on oil prices and believe that prices in the triple digits remain a distinct possibility at some point in the first half of 2018. Investors remain bearish. The energy weighting in the Standard & Poor’s stock index is near all -time lows and oil prices have bottomed and are now heading higher. Energy names have been poor performers this year (for example the S&P Exploration and Production and the S&P Oil Services Indices are down 17% and 25% for the year), but we believe investors today are being presented with a buying opportunity of an lifetime. We offer our detailed analysis of today’s oil market the “Oil Section” of this letter.
Elsewhere in the market, precious metals and related stocks were lackluster. Gold was up 3%, while gold stocks were up less than 1% during the quarter; silver was flat; and platinum was down slightly. Palladium was the standout—rising almost 12%. Back in April of 2016, we discussed at length the historical relationship between gold and oil going all the way to the 1850s. We pointed out that whenever an ounce of gold was priced at 30 times the price of an oil barrel, then oil and oil-related investments represented excellent value. This ratio almost hit 30 back at the end of June and in September it hit 29. Although we like gold here, the historical relative cheapness of oil to gold makes us favor the former over the latter.
And finally regarding agriculture, we remain neutral on the group. Good growing conditions here in the US have again produced another huge crop, and grain prices were weak during the third quarter. Wheat prices fell 13% and corn fell 4%. Because of continued strong demand from China, soybean prices actually bucked the bearish trend and rose 3% during the quarter. Given the potential for a huge 2017 harvest, with the world again facing extremely large ending grain inventories, we remain neutral on the grains and have cut back on our agriculture related investments.