As proof we live in interesting times, just consider the gold-oil ratio over the last few months. Because of the impact of COVID-19 on the global economy, the gold-oil ratio has reached the highest levels in history. For example, on April 20th 2020, an ounce of gold purchases over 400 barrels of oil – ten times the previous records reached in the depths of the Great Depression in 1933 and nine times the level reached during the panic lows of early 2016.
Gold-Oil Ratio
1860-2020
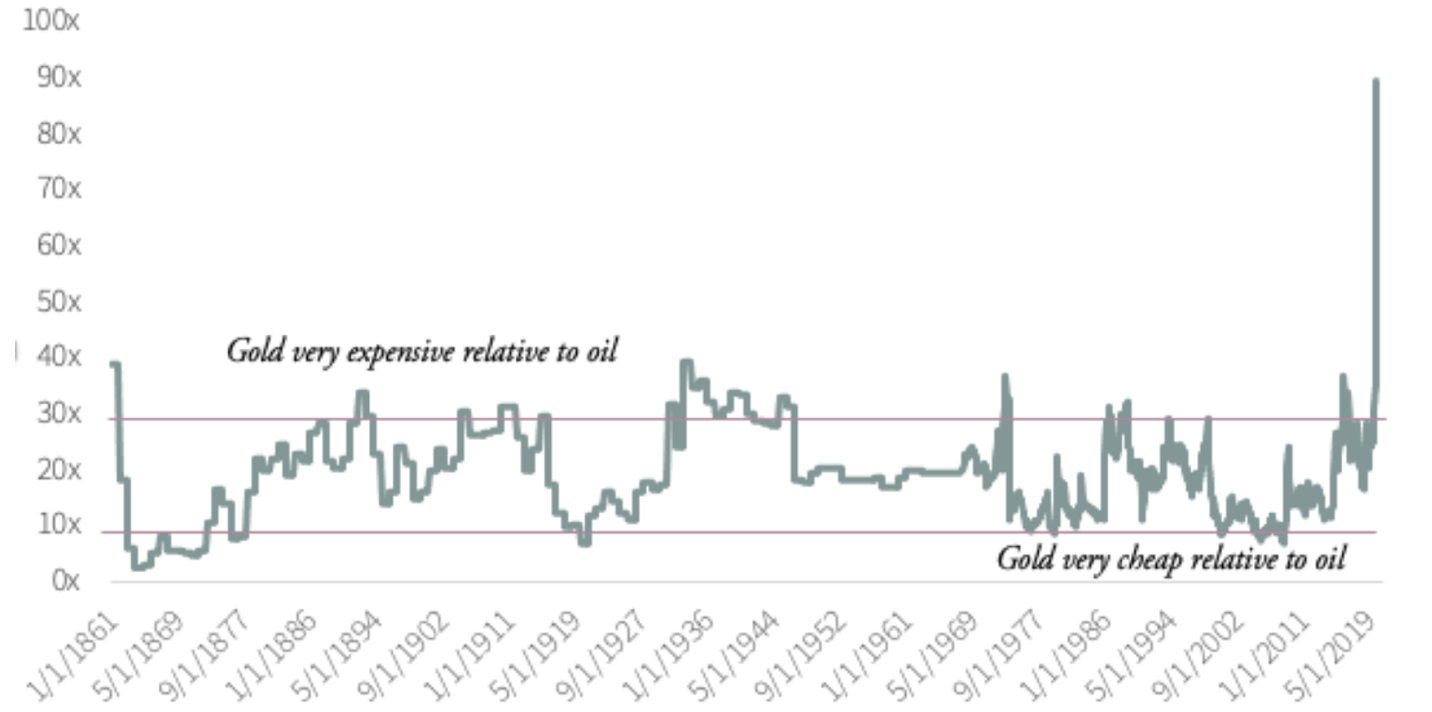
Source: Bloomberg, BP Statistical Review, G&R Estimates.
Gold and oil have each experienced booms and busts, wars, financial panics, deflationary depressions, gold standards, gold exchange standards, fiat dollar standards, fixed exchange rates, floating exchange rates, oil market share wars, oil shortages, geopolitical tensions, periods of calm, and even prior pandemics. Despite such an incredibly wide variety of backdrops, the gold-oil ratio has spent 80% of the time between 10:1 and 30:1.
Distribution of Gold-Oil Ratio
1860-Present
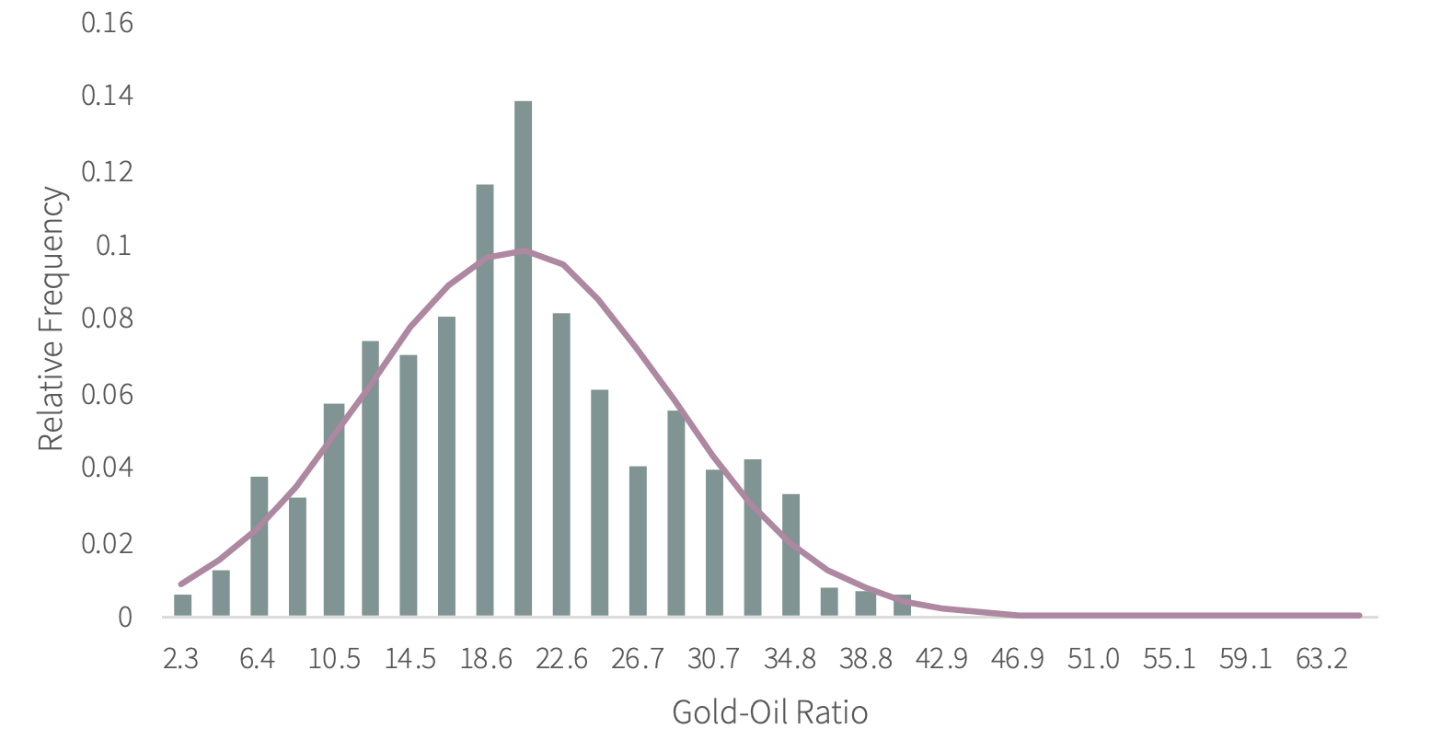
Source: Bloomberg, BP Statistical Review, G&R Estimates.
Between 1900 and today, one ounce of gold has purchased 20 barrels of crude oil on average, with a standard deviation of 8 (using monthly data). As we mentioned, 80% of all observations are between 10:1 (gold is cheap relative to oil) and 30:1 (oil is cheap relative to gold). According to the historical distribution, a gold-oil ratio of 150 is an eight standard deviation occurrence that is only expected once every 10,000 years – clearly a “black swan” event.
The gold-oil ratio has been a reliable indicator of when to invest in oil and when to invest in gold over the past 120 years. Since 1900, crude has averaged a 12-month gross return of 7% while gold has averaged a 12-month gross return of 5%. Oil has generated a negative 12-month return 39% of the time while gold has generated a negative return 32% of time.
However, looking only when the gold-oil ratio has exceeded 30:1 (i.e., oil is cheap relative to gold), crude has returned 32% on average over the next twelve months (over four times its long-term average), while gold has returned 4% on average. Oil was lower only 13% of the time (70% less often). On average, oil outperformed gold by 28% during these periods compared with 2% normally.
At the other extreme, when the gold-oil ratio was less than 10:1 (i.e., oil was expensive relative to gold), crude lost 7% on average over the next twelve months and was negative nearly 60% of the time. Gold returned 18% on average during these periods, outperforming oil by 25%. Since 80% of all observations occur when the ratio is between 10 and 30 you should expect the relative returns of both gold and oil to be like their long-run averages and that is exactly what occurred. When the ratio was between 10 and 30, oil returned 5% on average in the following 12 months, and was lower 41% of the time while gold returned 4% and was lower 33% of the time, roughly in line with long-term averages.
We last used this analysis in early 2016 to justify our investments in oil-related securities. At that point, the gold-oil ratio hit a then-record 47:1. We argued that oil prices were set to surge and invested in oil-weighted E&P securities as a result. Over the next 30-months, oil rallied by 191% from $26 per barrel to $76 per barrel by October 2018. Gold on the other hand fell by 4% over the same period. Oil stocks (as measured by the XLE ETF) advanced by 56%, well in excess of gold stocks (as measured by the GDX) which rose only 3% but lagging the S&P 500 which advanced 69%.
Given the recent 400:1 ratio, we believe an unprecedented buying opportunity is presenting itself in oil and oil-related stocks. Nearly every example of an extreme high reading in the gold-oil ratio is followed by a full reversal to an extreme low reading of 10:1. If that is correct, then oil prices are set to increase dramatically.
*This blog is an excerpt from our Q1 2020 Market Commentary. All data is as of 3.31.2020.
Would you like to learn more about the Goehring & Rozencwajg investment process? It would be our pleasure to set up a call between you and a portfolio manager on our team. Click below for more information.