“Even adjusting the Fed’s balance sheet for excess reserves (a debate in and of itself), we believe today’s balance sheet justifies a gold price in excess of $15,000 per ounce on the low side or $25,000 per ounce on the high end.”
While this week’s blog is centered on gold, let’s take a moment to reflect on the second-quarter performance of various precious metals. Gold advanced 13% and silver rebounded a strong 34% during the period. Platinum advanced 13% and palladium fell 18%. Year to date, gold is now up almost 26% while silver has regained all its first quarter losses and is up 3%; platinum is down 14% and palladium is flat. Reflecting the strength in the metals, both gold and silver equites surged. Gold stocks (as measured by the GDX ETF) rose almost 60% and silver stocks (as measured by the SIL ETF), rose 56%. For the year, gold stocks are rivalling the performance of the FANG and large cap tech technology sectors of the markets.
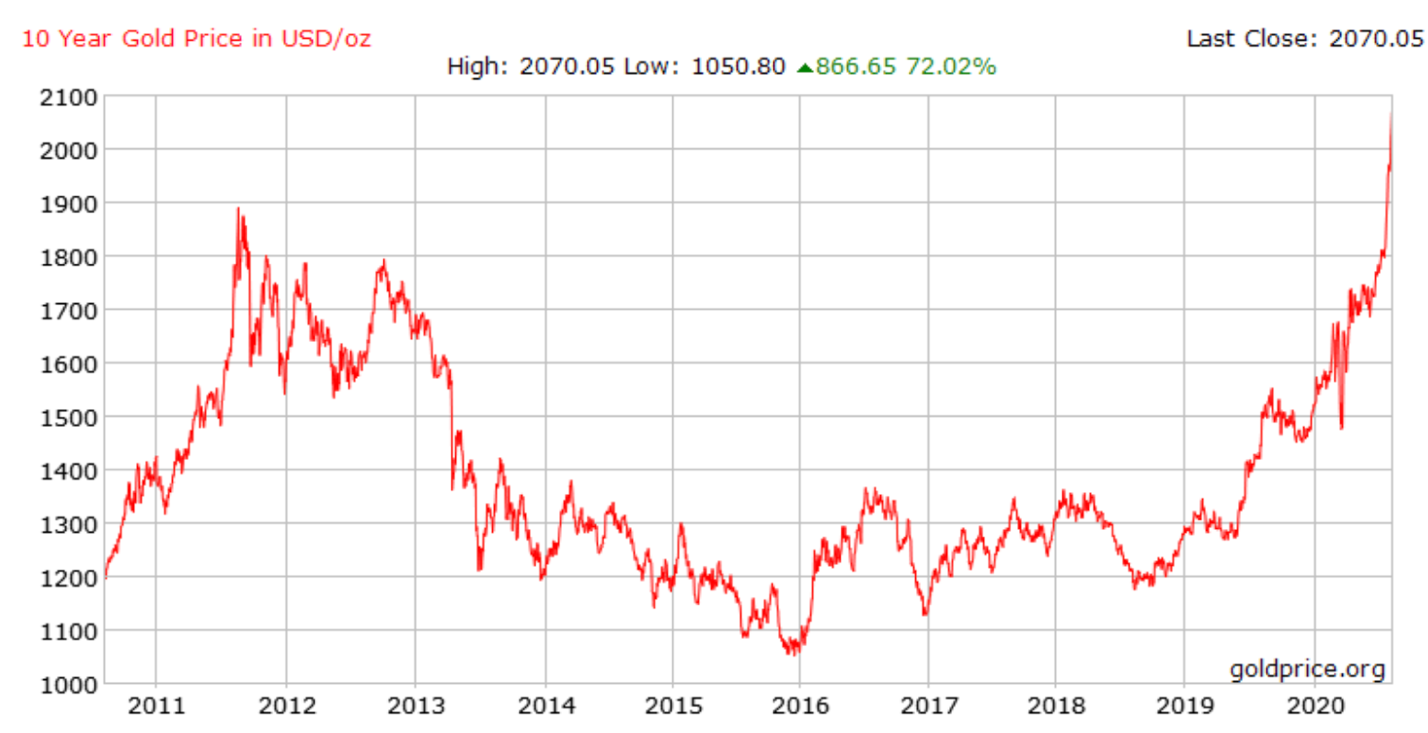
Gold has surpassed $2,000 per ounce and has established several new all-time daily highs. The previous high occurred on September 5, 2011. Although the gold price today is only slightly higher than it was nine years ago, the financial world has completely changed.
Over that time, the Fed’s balance sheet has advanced 137% to total nearly $7 tr. The European Central Bank’s (ECB) balance sheet has grown 145% to reach E4.6 tr. The Japan Central Bank’s (JCB) balance sheet growth leads the pack, having advanced 365% to reach 640 trillion yen.
There is an historical relationship between the size of a central bank’s balance sheet and the price of gold going back to the Federal Reserve’s establishment in 1913. Even adjusting the Fed’s balance sheet for excess reserves (a debate in and of itself), we believe today’s balance sheet justifies a gold price in excess of $15,000 per ounce on the low side or $25,000 per ounce on the high end. For a complete discussion of the relationship between the size of the Fed’s balance sheet and the price of gold, please consult our 2Q2018 letter.
We have written how the current gold bull market will be driven by Western investors, compared with its first leg which started in 1999 and ended in September 2011 and was dominated by Eastern buyers, particularly from India and China. We also explained how the upcoming bull market would have a huge speculative element to it – again quite different from the first leg of the bull market that was mostly orderly and driven by value-conscious Eastern investors.
The second quarter provided more evidence the Western buyer has returned. Accumulation of metal through the physical gold and silver ETFs (a proxy for Western buying) continues to surge. For the first quarter of 2020, the 17 physical gold ETFs we follow accumulated 228 tonnes and this continued into the second quarter.
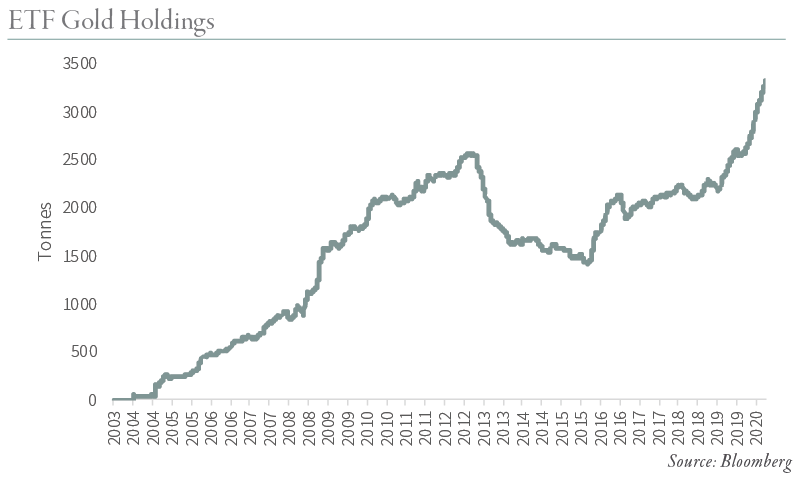
Second quarter gold ETF accumulation totaled 395 tonnes. Through the first three weeks of July, they have added another 120 tonnes. Year to date, gold ETFs have accumulated over 730 tonnes, already more than doubling the 360 tonnes accumulated in 2019. Given that gold continues to gain both momentum and investment popularity, strong Western gold support should continue.
After trading sideways for the last four years, silver finally broke out of its trading range over the last few weeks. Just like the gold ETFs, the seven physical silver ETFs we follow saw a surge in accumulation. Year to date, the ETFs have added 7,842 tonnes of silver – more than three times the 2,573 tonnes accumulated in 2019.
The breakout in silver is further conformation the bull market in gold is now well underway. Although we continue to prefer oil and oil-related investments to gold here, (please see our recent blog “The Gold-Oil Ratio Revisited”), we continue to think precious metals have entered into a large sustained bull market. If we see a significant pullback in precious metals — for example if a COVID-19 vaccine is introduced — we would use the weakness to add further to our investments. Precious metals have entered into a huge bull market that will eventually take gold significantly past $10,000 per ounce later this decade.
Interested in reading more on this topic? Download our Q2 2020 Research,
On the Verge of an Energy Crisis, where we explore this subject and many others.