
We believe that the upcoming next leg of gold’s bull market will be driven by western buyers, a subject we discussed in our 2Q 2019 Letter. Last decade’s gold bull market, which lasted 10 years and saw the price of gold rise almost seven-fold, was dominated by buyers from the East — primarily from China and India.
TO READ OUR PREVIOUS RESEARCH LETTERS, PLEASE VISIT OUR COMMENTARY LIBRARY.
In the first leg of last decade’s bull market, which ended in 2008 when gold hit $1,000 per ounce, western gold market participants spent most of their time not buying, but selling gold. For example, western central banks only stopped selling their gold in 2008 and hedge funds and other western speculators were significantly short throughout much of the advance. Also, a large number of western gold producers were still forward-selling their gold production as the first leg of the gold bull market unfolded.
It took all the way until 2009 for the biggest proponent of gold forward-selling—Barrick Corp—to admit that it could no longer stand the financial pain of maintaining a massive short position. In September 2009, they announced they were closing out their forward sale program and would take a $5.6 billion loss. Also, it was only after the 2008 financial crisis that we began to see any interest in gold from western investors. Several high-profile hedge funds made pronouncements that they had accumulated gold positions, but the hedge funds were late to the game. By 2009, the first leg of the gold bull market only had three years left before it peaked out and, once the gold price began its pullback at the end of 2011, western investors spent the next four years liquidating all the gold they had accumulated since 2008— almost 1,500 tonnes.
Gold Prices,
Trailing Ten-Years as of 12/2019
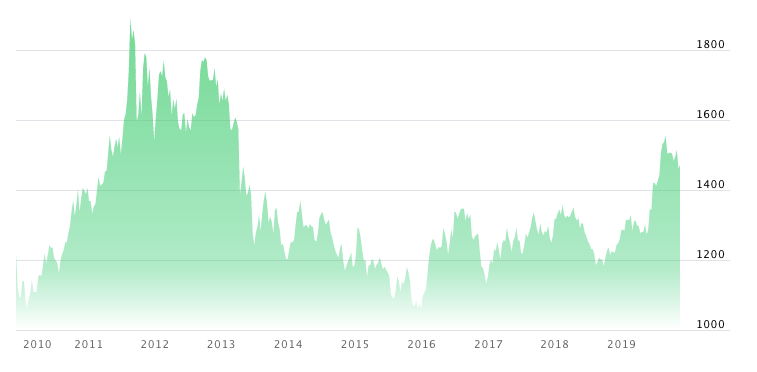
Source: Nasdaq.com
The complete absence of western buying, combined with the measured buying by both the Chinese and Indians, who thought gold was a cheap asset class that deserved long-term accumulation, produced a long bull market characterized by low volatility and little speculative activity. As opposed to the gold bull market of the 1970s, the gold bull market of the 2000s was extremely measured and orderly and the advance from $250 to $1,900 per ounce received little comment from the financial press.
For those with long memories, remember how different the 1970s gold bull market was from the one experienced last decade. The final leg of the 1970s bull market in gold was driven by western investors and both gold and silver exhibited high levels of speculative activity which included the attempted corner of the silver market by the Hunt Brothers. In 1979 alone, the gold price advanced by over 150% and silver exploded by over 230% in price.
Are we beginning to see the return of the western interest in the gold markets? We believe that we are. Tracking the accumulation of gold and silver through their respective physical ETFs is a good way to gauge the movement. The 17 physical gold ETFs we follow have shown consistent accumulations throughout 2019. By our calculation, they have accumulated 40 tonnes of metal in Q1, 59 tonnes in Q2, and 214 tonnes in Q3. The accumulations continue into Q4. In the first three weeks of October, another 35 tonnes was accumulated. For all of 2019, physical gold ETFs have accumulated 350 tonnes of metal and total holdings now stands at 2,560 tonnes— almost equal to their 2012 peak.
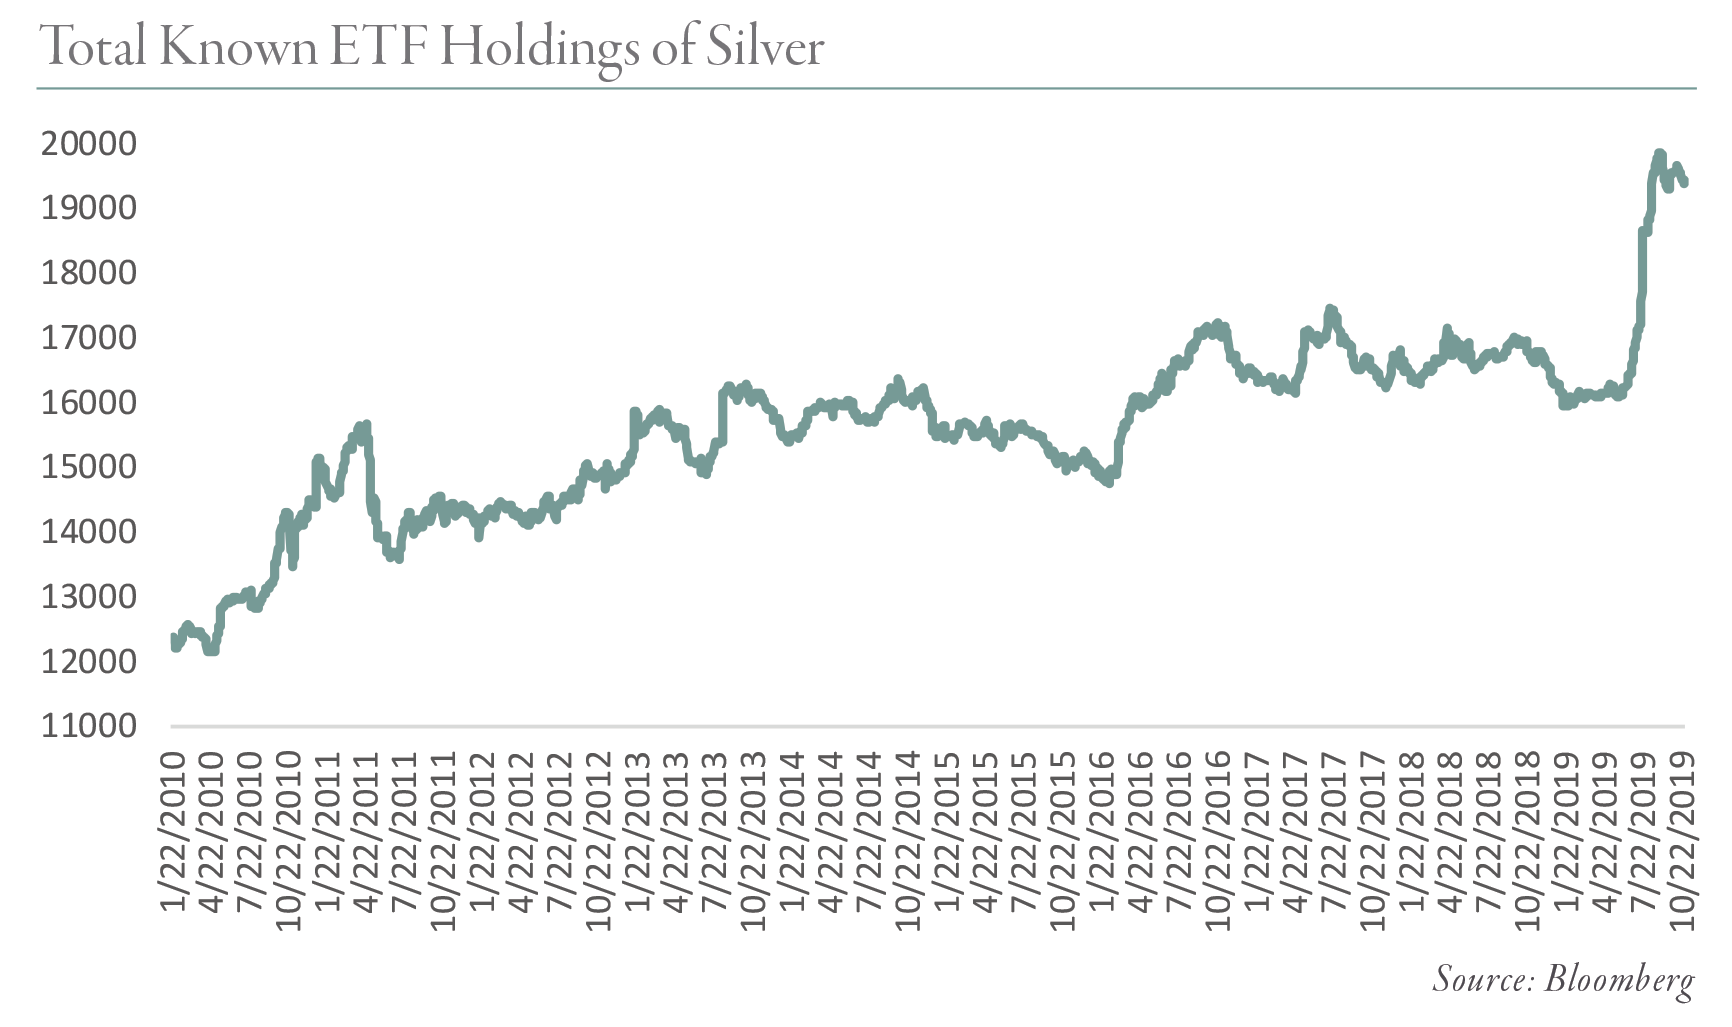
Accumulations also continue in the physical silver silver ETFs we track. In Q1, the nine we track shed 166 tonnes of metal. However, starting in Q2, they began an aggressive period of accumulations. In Q2, silver ETFs accumulated 470 tonnes, in Q3, they accumulated 2,900 tonnes, and the accumulation continued into Q4. For the first three weeks of October, silver ETFs accumulated an additional 59 tonnes. Over the last eight years, the total silver held by ETFs traded in a range between 15,000 and 16,000 tonnes, but as you can see from the chart below, total accumulations, now standing at 19,500 tonnes, have definitely broken out to the upside after being range-bound for 10 years.
In our Q2 2019 letter, we reiterated our gold price target of $12,000 per ounce—a price target that will potentially be reached in a period of huge speculation not unlike one we saw 40 years ago. The huge amount of money created by central banks has combined with the massive increase in total indebtedness over the last nine years have led to major distortions including the emergence of widespread speculation in the global bond markets. This distortion in particular is apparent when considering the recent sale of 30-year German debt with negative yields. All of these distortions have created the perfect backdrop for the upcoming bull market in precious metals.
Western investors have begun to recognize this, and have started placing their bets. The gold bull market has now begun.
In our Q3 2019 commentary, WHAT IS HAPPENING TO US SHALE PRODUCTION?, we explore this subject and many others. If you are interested in reading our in-depth research piece, please download the document below.
