“We believe we are potentially entering a significant period of decreased sunspot activity, with resulting severe weather implications.”
What is a sunspot and how does it affect the earth’s weather? A sunspot is an area on the sun’s plasma surface that forms when intense magnetic activity is taking place. Why they form is still unclear, but we now know by using sophisticated measurement techniques that the areas surrounding a sunspot exhibit strong magnetic activity caused by huge magnetic storms known as “coronal mass ejections.”
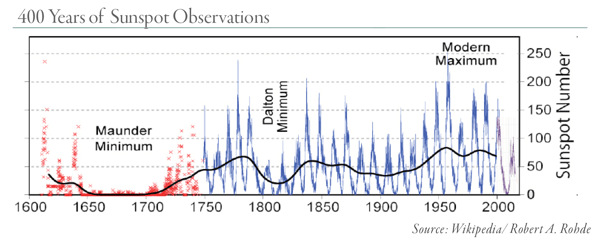
More sunspots on the sun’s surface equates to more magnetic energy being released. One of the more intriguing phenomena noticed by scientists studying 700 years of data was first described by solar astronomer Jack Eddy in a 1976 paper in “Science.” According to these observations, periods of low (or even non-existent) sunspot activity have been associated with periods of global cooling. The most famous examples of this potential relationship were the Maunder and Dalton Minimums, discussed in previous blogs, when decreased activity was associated with the coldest periods of the Little Ice Age. To this day scientists and climatologists debate the impact of solar cycles and magnetic energy on global weather patterns, although few deny that these minimums did indeed coincide with periods of intense terrestrial cooling. Although still only partially understood (and vastly complicated by the fact that both periods saw surges in volcanic activity -- another important factor contributing to periods of global cooling), it is a fascinating coincidence.
Scientists now believe that during periods of low sunspot activity when magnetic activity is low, the sun’s shrunken magnetic field fails to deflect cosmic rays (high-energy radiation) coming from other parts of the galaxy. These rays not only produce carbon-14 (which can be identified through tree-ring analysis), but also ions which enhance the formation of aerosols and ultimately clouds in the earth’s atmosphere. Conversely, periods of high sunspot activity and increased magnetic output serve to deflect cosmic rays, ultimately hindering the formation of clouds.
Thus, some scientists believe that periods of low sunspot activity will result in increased global cloud cover (which could have cooling effects) while periods of high sunspot activity could result in less global cloud cover (which could have warming effects). Scientists continue to vigorously debate the sun’s influence on global weather patterns. While the theories we just described have become more accepted, the magnitude of their influence on global climate remains highly debated.
Confusing this whole issue has been the fact that the two most recent periods of reduced sunspot activity have also been associated with periods of significant volcanic activity. For example, during the Dalton Minimum, Mount Tambora erupted in 1815 which is believed to be the most powerful volcanic eruption in recorded history and cause of the famous “year without a summer” in 1816. Although not officially recorded, scientists also believe that the Long Island volcano in Papua New Guinea erupted spectacularly in approximately 1660, right in the middle of the Maunder Minimum. Through studying ice and sediment cores and dead vegetation, scientists also believe the world experienced four massive volcanic eruptions between 1275 and 1300, which coincided with the beginning of the Sporer Minimum (and first extremely cold spell of the Little Ice Age). This era marked another period of extremely low sunspot activity between 1400 and 1520, now confirmed by the carbon-14 testing of tree rings.
It now looks like the three coldest periods of the Little Ice Age occurred not only during periods of extremely low sunspot activity, but also extremely active volcanic activity. Is there a link between sunspot activity and volcanic events? Although we do not have enough time to discuss this subject (which is hotly debated among scientists), we want you to keep an open mind on the subject. There are many scientists that think a link might exist. If it does, we could see a potential surge in volcanic activity in the next 20 years which could add significantly to the forces at work to cool the global climate.
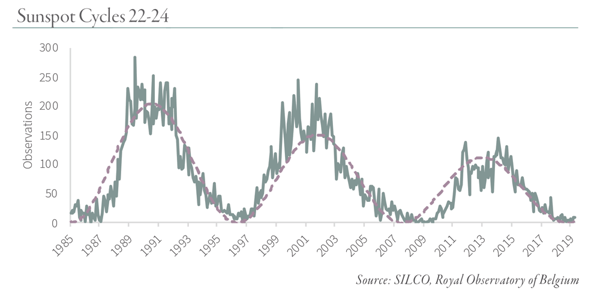
As you can see from the chart below, the Modern Maximum solar cycle seems to have peaked during sunspot-cycle 22, which ended in 1996.
Sunspot cycle-23 and the just completed cycle-24 each had peak levels far below those of the previous cycles. Cycle-24 was unique in other ways as well. The upswing in sunspot activity during cycle-24 occurred very late in its cycle and the activity was very weak. Although we do not have enough time to discuss all the potential reasons for this weakness, there seems to be some consensus that the weakening of the sun’s magnetic field is responsible for the most-recent decrease in sunspot activity.
Just as the sun goes through its observable 11-year sunspot cycle, it also goes through long periods of magnetic field strengthening and magnetic field weakening that is less understood by the solar community. Over the last 20 years, many solar observers believe that we have seen a significant weakening of the sun’s overall magnetic field strength. Given that sunspot cycles and related magnetic field strength seem to go through approximate 85-year and 200-year cycles, we are now almost right on schedule for a potential repeat of the Dalton and possibly the Maunder Minimum periods.
We believe we are potentially entering a significant period of decreased sunspot activity, with resulting severe weather implications.
We are just starting sunspot cycle-25. On November 19, 2018 a small sunspot appeared in the sun’s northern hemisphere before quickly disappearing. Its magnetic field was reversed, suggesting that the 25th sunspot cycle had now started. If increases in the solar activity at the beginning of the 25th cycle appear slow, we will have confirmation we are entering into another cycle of weak sunspot activity that could last for decades.
The subject of sunspot activity is extremely complicated. Its impact on the earth’s weather is even more so. Over the last 120 years, we have been in a period of extremely high sunspot activity which would very well have been contributing to the simultaneous warming of the climate. Although it’s impossible to separate the impacts from increases in both sunspot activity and atmospheric CO2 concentrations, one cannot help but notice that a large part of the warming trend over the last 120 years took place previous to 1950, a period where CO2 concentrations in the Earth’s atmosphere remained relatively low. If we are now entering a lengthy period of reduced sunspot activity, it is possible that the global warming trends of the last 120 years could reverse as well.
Although never discussed in the popular or financial press, global cooling trends (as opposed to warming) have historically been associated with sub-optimal growing conditions - something very difference from what the world has experienced over the last 70 years. If we are right and the weakness of the last sunspot cycle (cycle-24) is the beginning of a long period of sunspot weakness, we could very well see many years of suboptimal growing conditions emerge as the global climate cools.
The end result will produce a massive bull market in agriculture markets as strong grain demand collides with weather-related constricted supply. The sunspot cycle and its potential impact on the earth’s climate is a subject that is vigorously debated in the scientific and meteorological community. We will continue to monitor this fascinating subject and the debate that surrounds it, updating our readers as new observations, information and opinions emerge. If we are correct in our analysis, the great bear market in grains is about to end and a huge new bull market is about to start.
This blog contains excerpts of our in-depth commentary, The Bell Has Been Rung. If you are interested in this subject, we encourage you to download the full commentary here.