
In previous quarterly letters, including Q3 2018 (Into The “Red Zone” We Go), we stated our belief that a huge new bull market would develop in gold that could take the metal to levels significantly higher than today’s price. Using several valuation techniques, we outlined how gold was as cheap as it had ever been.
For example, priced against financial assets and the amount of Federal Reserve credit outstanding, gold had reached valuation extremes that had only be been reached twice in the last 50 years; once in 1970 and again in 1999. In retrospect, we know that both those periods were excellent times to be an aggressive investor in precious metals markets.
End-of-Day Commodity Futures Price Quotes for Gold (COMEX)
Trailing Ten Years
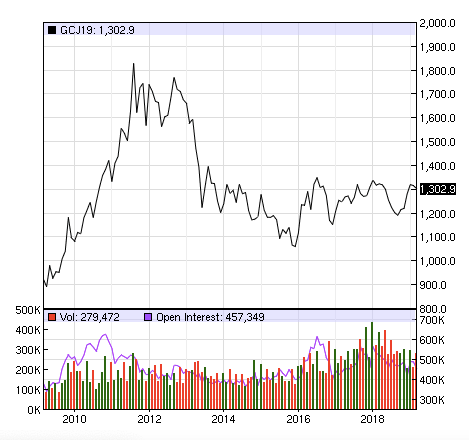
Image Source: Nasdaq.com
Today, we would like to discuss another indicator that has fallen into place that also suggests the eight-year bear market (really, four years of price pullback and now a fourth year of trading sideways) is drawing to a close. This indicator, the gold-silver ratio, suggests that both precious metals markets represent deep investment value and that a significant bull market move in both metals lies in the not too distant future.
Examining the Gold/Silver Ratio since 1980
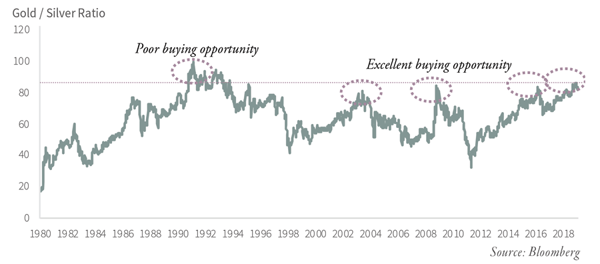
For those unfamiliar with the gold-silver ratio, it is nothing more than the price of gold divided by the price of silver. Ever since the US government ended the dollar gold peg with the dissolving of the Bretton Woods agreement in 1971, the relationship of the price of gold and silver has repeated itself multiple times over the last 50 years.
In gold bull markets, the gold-silver ratio shrinks, as the price of silver rises faster than the price of gold. In severe bear markets, the ratio expands, as the price of silver falls faster than the price of gold. Since 1971, there have been five times when the gold-silver ratio has surpassed 80 (when an ounce of gold buys 80 ounces of silver), and in four of those instances, it paid to accumulate significant positions in both metals. Only in 1990, when the gold-silver ratio almost broke 100, did this ratio give off a buy signal that did not result in an ensuing bull market.
The first period when the gold-silver ratio exceeded 80 occurred back in the in Q4 of 1990. It lasted for four years. Silver bottomed in price in February of 1991 at $3.50 per ounce and with gold at $350, and the gold silver ratio hit 100 − a level that we have never reached again. Although silver made a double bottom in March of 1993, it traded sideways (except for the short-term “Buffet” rally at the end of 1997) until it bottomed at $4.60 in the first quarter of 2003, which you will see is an important date. In retrospect, we know the peaking of the gold-silver ratio in 1991-1993 had no significance to gold. Gold during that time period traded around $350 per ounce and didn’t bottom until 1999-2001, at a price almost $100 per ounce lower.
The second time the gold-silver ratio hit 80 was in the March 2003 when silver bottomed at $4.30 per ounce and gold was still at $345 per ounce. In this instance, the gold-ratio hitting 80 gave precious metal investors a great buy signal. Over the next five years, gold advanced 190% (from $345 to $1000) and silver advanced by almost 390% (from $4.30 to $21).
After the 2008 financial crisis, silver prices fell over 55% and gold fell almost 30%. In November 2008, the gold-silver ratio surpassed 80 for the third time and the gold-silver ratio flashed another great buying opportunity. Silver and gold bottomed at $9.20 and $720, respectively, and then proceeded to advance 420% (silver peaked at almost $50) and 160% (gold hit $1,900) in the next three years. In the next four years, gold proceeded to pull back 45% and silver by over 70% and, by the first quarter of 2016, the gold-silver ratio broke 80 again, the fourth time. Silver had a strong advance in 2016 and the gold-silver ratio retraced slightly to 75 by last summer. With silver pulling back to $14 in September and gold rising above $1,200, the gold-silver ratio in November surged above 80 and hit 86 at the beginning of December, the fifth time. Although it’s not a perfect indicator, we believe a gold-silver ratio above 80 is another sign that the upcoming bull market in precious metals is drawing closer and closer.
More and more pieces of the bull market puzzle are now falling into place. Many of these indicators, whether they be valuation or sentiment, are now indicating that a huge bull market in precious metals prices will start in the next several years. As of today, the only indicator that continues to suggest that we are still in corrective trading is the ratio of the price of gold to oil. With the big pullback in oil prices and the upward move in oil prices in Q4, the gold-oil ratio hit 30 − traditionally a level that indicates oil will spend significant periods of time outperforming gold. Given the extremely high reading of the gold-oil ratio today, we believe that oil today represents a better investment over the next 12 months.
For investors with long-time horizons, we believe they should be accumulating investments in precious metals. For those with performance constraints, the history of the gold-oil ratio suggests that that we are still in the corrective phase of the precious metals market that started back in Q1 of 2016.
This blog contains excerpts of our in-depth commentary “OIL BULL MARKETS PAST & PRESENT, AND YELLOW JACKETS”. If you are interested in this subject, we encourage you to download the full commentary here.
