“Given silver’s huge move in the last six months, gold and precious metals could now go through a potential correction phase within a larger bull market.”
In gold bull markets over the last 50 years, silver has shown a strong tendency to lag the advancing gold price, often for many years before catching up suddenly in a spasm of speculative activity. Following silver’s advance, both metals often spend years correcting in price. Why this happens remains a mystery to us at Goehring & Rozencwajg, but it is a pattern that has played out multiple times over the last half-century and may have just repeated itself again.
After President Nixon took the US off the Bretton Woods gold exchange standard in August 1971, gold staged a massive rally. In three years, the gold price soared 350% from $40 to over $180 an ounce. Silver lagged the gold price consistently over that period. Prior to this policy move, the gold-silver ratio stood at 25 (one ounce of gold bought 25 ounces of silver). As gold strongly advanced and silver lagged, ratio peaked out at 47 in the summer of 1973.
Silver then staged a massive catch-up rally that saw the silver price advance 120% in just three months. The gold-silver ratio collapsed from 47 in August of 1973 to just 19 by February 1974. Although gold was able to eke out a new high ($185 per ounce) in Q4 of 1974, the first leg of the gold bull market was clearly over. Gold spent the next four years correcting and it wasn’t until the summer of 1978 that it was able to surpass its 1974 high.
Silver’s next explosive catch-up rally occurred in 1979 during the final parabolic blow-off phase of the 1970s great precious metals bull market. By the end of 1978 the gold-silver ratio was again approaching 40. In one of the most powerful bull markets moves ever, silver advanced almost 800% over the next 12 months, briefly piercing $50 per ounce in January of 1980. The massive rally in silver again tipped investors off that the precious metals bull market was about to end, which it did in spectacular fashion. Both gold and silver peaked in January of 1980 and spent the next 20 years grinding away in a bear market that saw both gold and silver prices fall 70% and 95%, respectively.
At the end of the great 2000s gold bull market, silver again made a huge catch-up move, signaling that gold was about to experience a significant period of weakness. Starting at the end of 2006, silver lagged the gold price for the next four years. The gold-silver ratio bottomed at the end of 2006 at 45 and by 2010 the gold-silver ratio had broken 70. Starting in Q4 2010, silver undertook a huge catch-up rally and bested its all-time high price of $50 set 31 years earlier. In just six months, the silver price more than doubled and the gold-silver ratio collapsed, falling from 70 to below 32. Again, the huge speculative move in silver predicted a lengthy period of precious metals price weakness. Gold prices peaked at $1,900 per ounce four months after silver peaked in 2011. Both metals entered a five -year bear market which saw gold prices fall by 45% and silver prices fall by over 70%.
Since gold prices bottomed in Q4 2015, silver prices have lagged the gold price advance. In Q2 2016, the gold-silver ratio bottomed at 65 and by 2019 the gold-silver ratio was flirting with its highest readings ever, in the mid-90s. Then the COVID-19 pandemic hit.
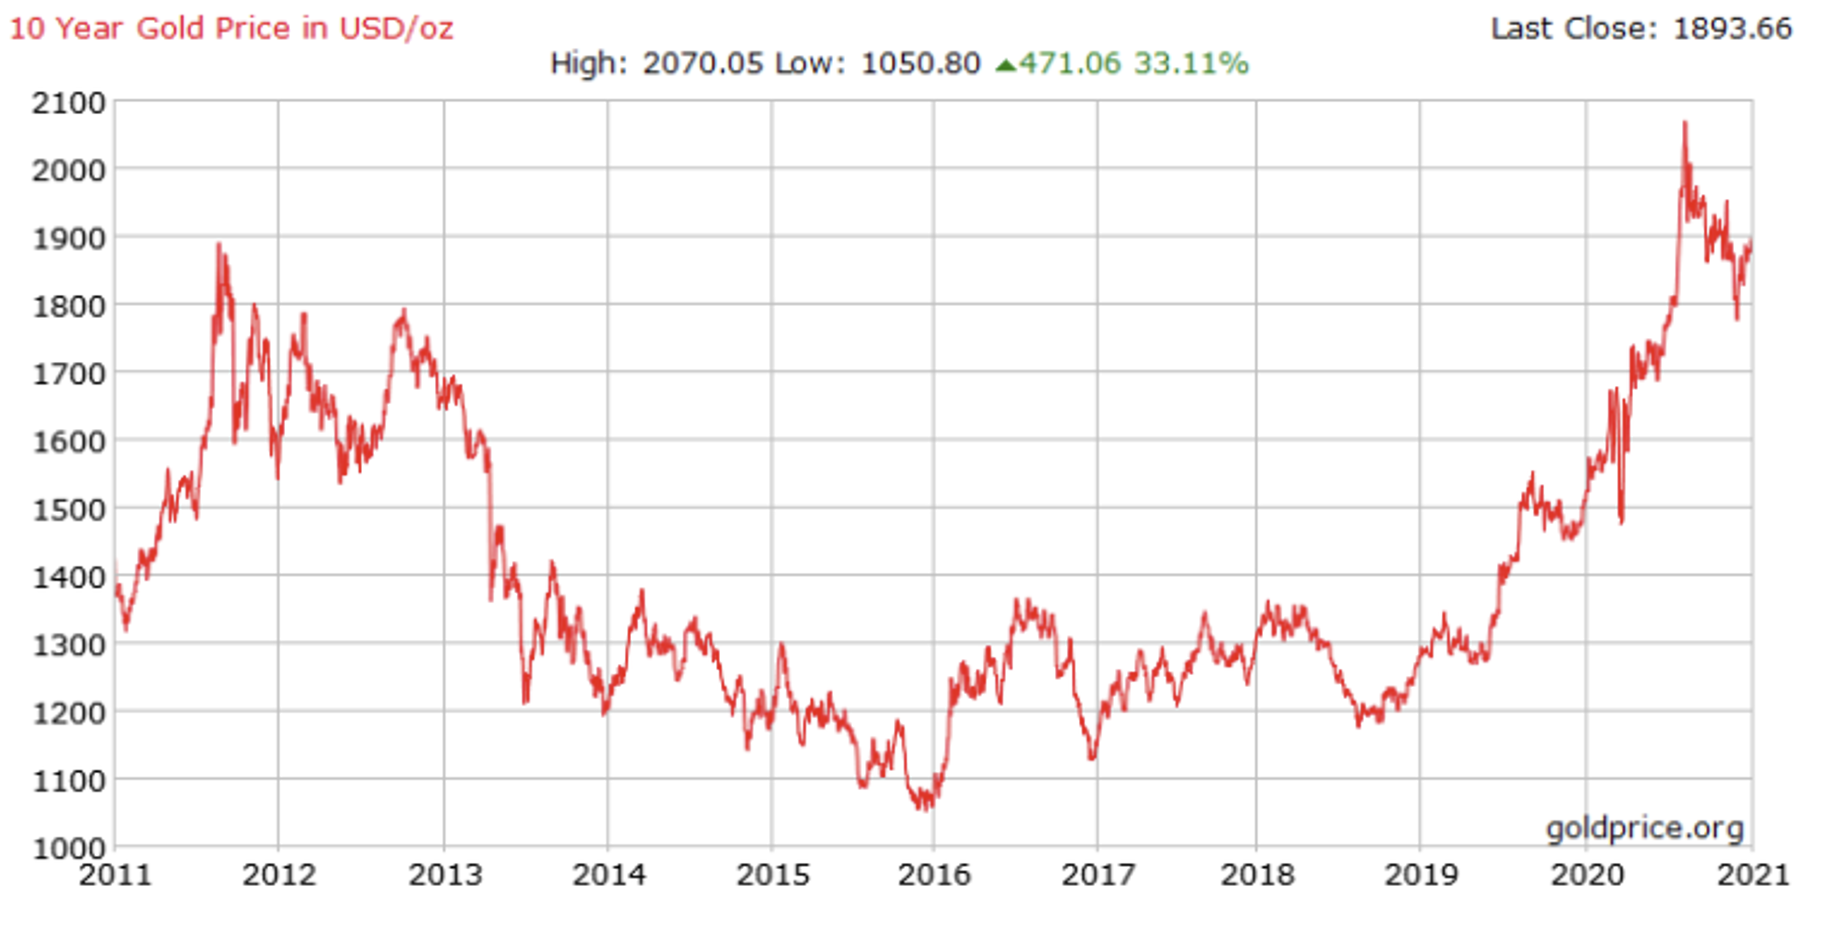
In response to the deflationary forces unleashed by the COVID-19 economic lockdowns, silver prices collapsed, and the gold-silver ratio skyrocketed to over 120 -- by far the highest reading ever recorded in the 2,000-year history of gold and silver prices we keep. The previous peak was registered in Q1 1991 when the ratio hit 100. After bottoming at $12 per ounce in March, silver has staged another impressive catch-up rally over the last six months. Silver prices have more than doubled and the gold-silver ratio has collapsed, falling from its peak of 123 to 70.
In 1973, the huge catch-up move in silver brought about a four-year corrective phase in the precious metals bull market that ultimately would last another 10 years. On the other hand, the silver catch-up moves that occurred in 1979 and 2010 -- 10 years after both precious metals bull markets started -- represented a serious warning that the good times were ending. We are extremely bullish on gold and do not believe we are repeating the 1979 and 2010 experience. However, given silver’s huge move in the last six months, gold and precious metals could now go through a potential correction phase within a larger bull market. We recommend investors use any such corrective phase to build up significant positions in both physical gold and silver and related equities.
There are two additional bearish demand stories that have developed in the last several months confirming our belief that gold might be entering a corrective phase. First, central banks have significantly slowed their gold purchases. Last year, central banks bought a record 660 tonnes of gold, capping off a 10-year buying binge that saw them accumulate 5,000 tonnes of gold. Since 2009, central banks have repurchased 70% of the gold they sold between 1990 and 2008. In the first six months of 2020 however, central banks slowed their purchases dramatically. Central banks bought 233 tonnes in the first six months of 2020 versus 385 tonnes in the same period last year.
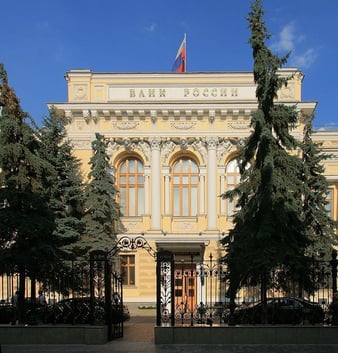
Central Bank of Russia, Moscow
The biggest source of the slowdown has come from the Bank of Russia. Since 2007, Russia has been a consistent gold buyer; over the last five years, the Bank of Russia has represented over 40% of all central bank purchases. However, after buying an additional 28 tonnes in Q1, the Bank of Russia announced it would suspend all additional gold purchases. The collapse in oil prices combined with the COVID-19 pandemic have significantly strained the government’s finances. Central banks actually turned into net sellers in August. Although this has happened five times over the last 60 months, the 12 tonnes of net sales in August is by far the largest amount in years. Making matters worse, almost 80% of the 250 tonnes of central bank buying since the beginning of 2020 was done by the Turkish Central Bank. Although Turkey is attempting to diversify away from the US dollar given that Turkey has been threatened with trade sanctions, it remains unclear how much longer Turkish gold purchases can continue given their precarious financial situation.
Second, bearish data has emerged from China. Over the last 20 years, China has surpassed India as the world’s largest gold buyer. In 2000, Indians bought approximately 850 tonnes of gold annually while China bought only 200 tonnes. By 2013, Indian gold consumption had grown to only 980 tonnes, while China’s annual gold consumption had exploded by over six-fold to 1,300 tonnes. Clearly, China has become the most important demand force in global gold markets but for the first time in a long time, there are mounting signs of demand weakness.
Over the last five years, gold traded on the Shanghai exchange has consistently traded at a significant premium ($5-$15) to the world gold price. Even with large inflows of physical gold into China, physical prices have traded with persistent premiums over world gold prices. Most gold analysts have attributed these premiums to extremely strong demand. In the last six months, these premiums have evaporated. Shanghai spot market prices have traded with discounts as great as $50 per ounce, which continues as we write. In previous letters, we have repeatedly made the case that the bull market in gold would be very different from the bull market of 2000-2011 in which western buyers were completely absent while eastern buyers were the dominant force. In this gold bull market—which we believe has started—western buyers will be the driving force and we might see eastern buyers turn into actually sellers as the gold price moves higher. This dynamic occurred in India back in the late 1970s. Are high gold prices beginning to dampen Chinese gold demand? It is something that needs to be watched closely and could add downward pressure to gold prices as we enter this corrective phase.
Interested in reading more on this topic? Download our Q3 2020 Research, Investing in the Uninvestable, where we explore this subject and many others.