The article below is an excerpt from our Q2 2022 commentary.
Ever since silver staged a furious catch-up rally back in the summer of 2020 -- something that has always signaled a long corrective phase -- both gold and silver have been quietly drifting downward. Since reaching their peaks in the summer of 2020, gold prices are now down 15% while silver has fallen more than 35%. Gold and silver equities, as measured by the GDX and SIL ETFs, pulled back over 40% and 50%, respectively.
In our last commentary, we outlined the emergence of several important fundamental trends that gave us confidence to say the correction phase in precious metals prices might be ending.
Unfortunately, one of the more important trends, which we thought was flashing a strong buy signal in Q1 has reversed. In past commentaries, we have discussed how the gold bull market’s next leg would be driven by western investors, not by eastern investors as was the case in the huge gold bull market between 1999 and 2011. We follow 16 publicly traded ETFs that invest in physical gold, to track the interest of western investors, which has now turned decidedly bearish.
Total Known ETF Gold Holdings
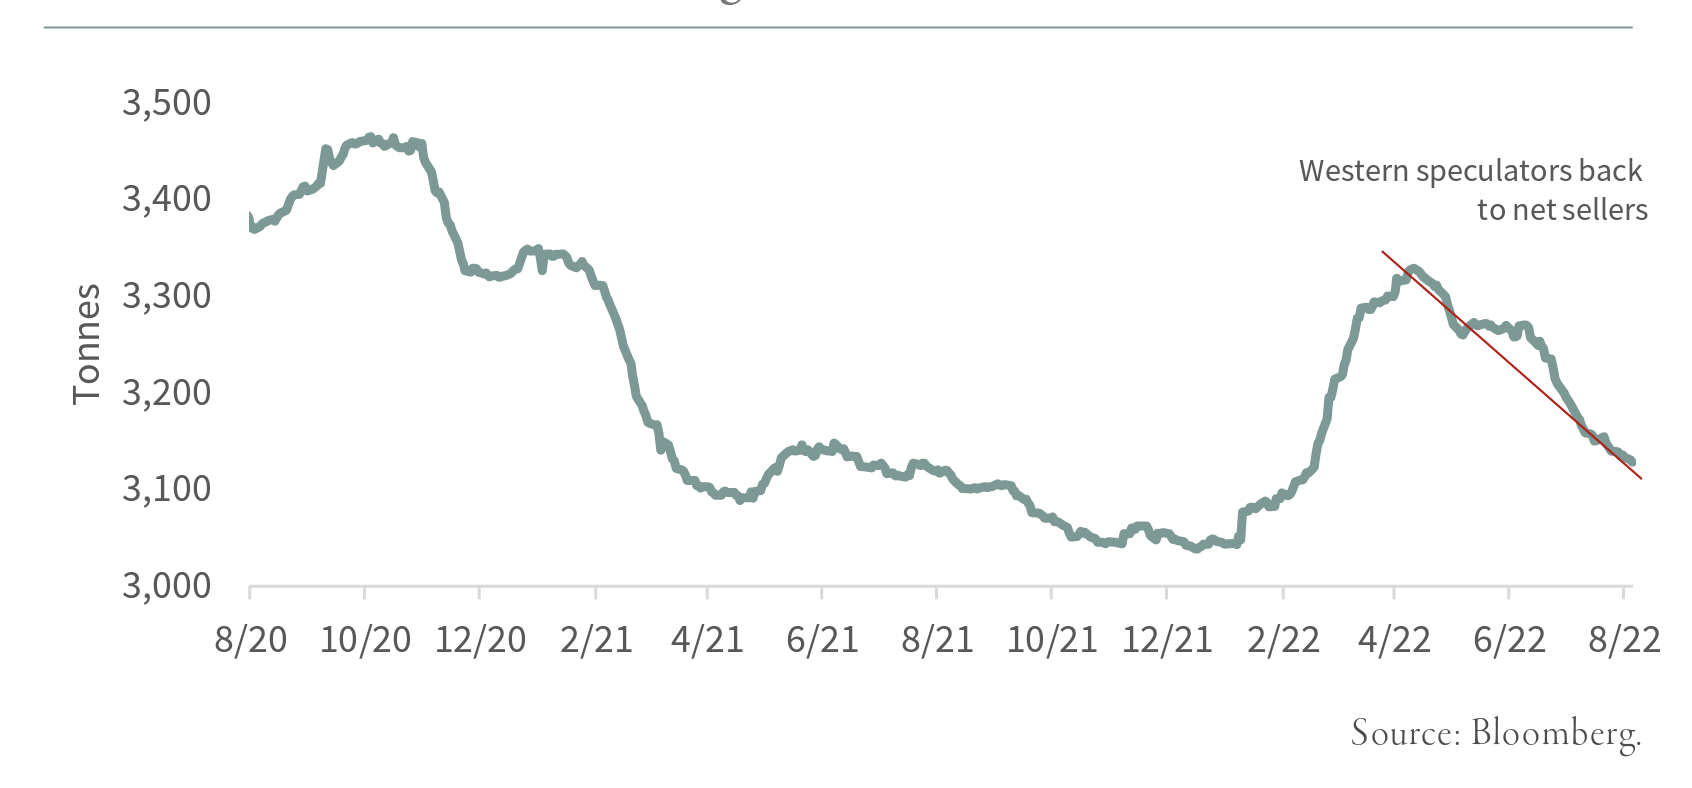
After aggressively accumulating almost 1,500 tonnes of gold between Q4 2018 and Q3 2020, our 16 ETFs spent the next 18 months liquidating almost 450 tonnes of gold or 12% of their holdings. The gold price peaked in August 2020 just as our 16 ETFs swung from accumulation to physical shedding. We believe gold selling from these ETFs produced the 15% pullback since September 2020.
In January, our physical gold ETFs swung from shedding to accumulating gold. From mid-January to the beginning of April, these ETFs accumulated almost 260 tonnes, approximately 60% of the gold they liquidated over the previous 18 months. Given the surge in both inflation and geopolitical tension initiated by Russia’s invasion of Ukrainian, we thought we had entered into a new phase of western accumulation and conjectured that prices would rise. However, starting in mid-April, the ETFs swung back again to being gold liquidators. Rising short-term interest rates produced a 10% surge in the trade weighted value of the US dollar whose strength has more than overcome spiking inflationary expectations and global tensions.
The accumulation behavior of the 10 physical silver ETFs we track has been even more bearish. Liquidations ended mid-January and our silver ETFs experienced a brief period of accumulation. However, by the end of February, the ETFs had returned to aggressively shedding silver. By mid-July, they had shed over 1,000 tonnes. Again, the strong dollar has more than overcome rising inflation and global tensions.
Total Known Silver ETF Holdings
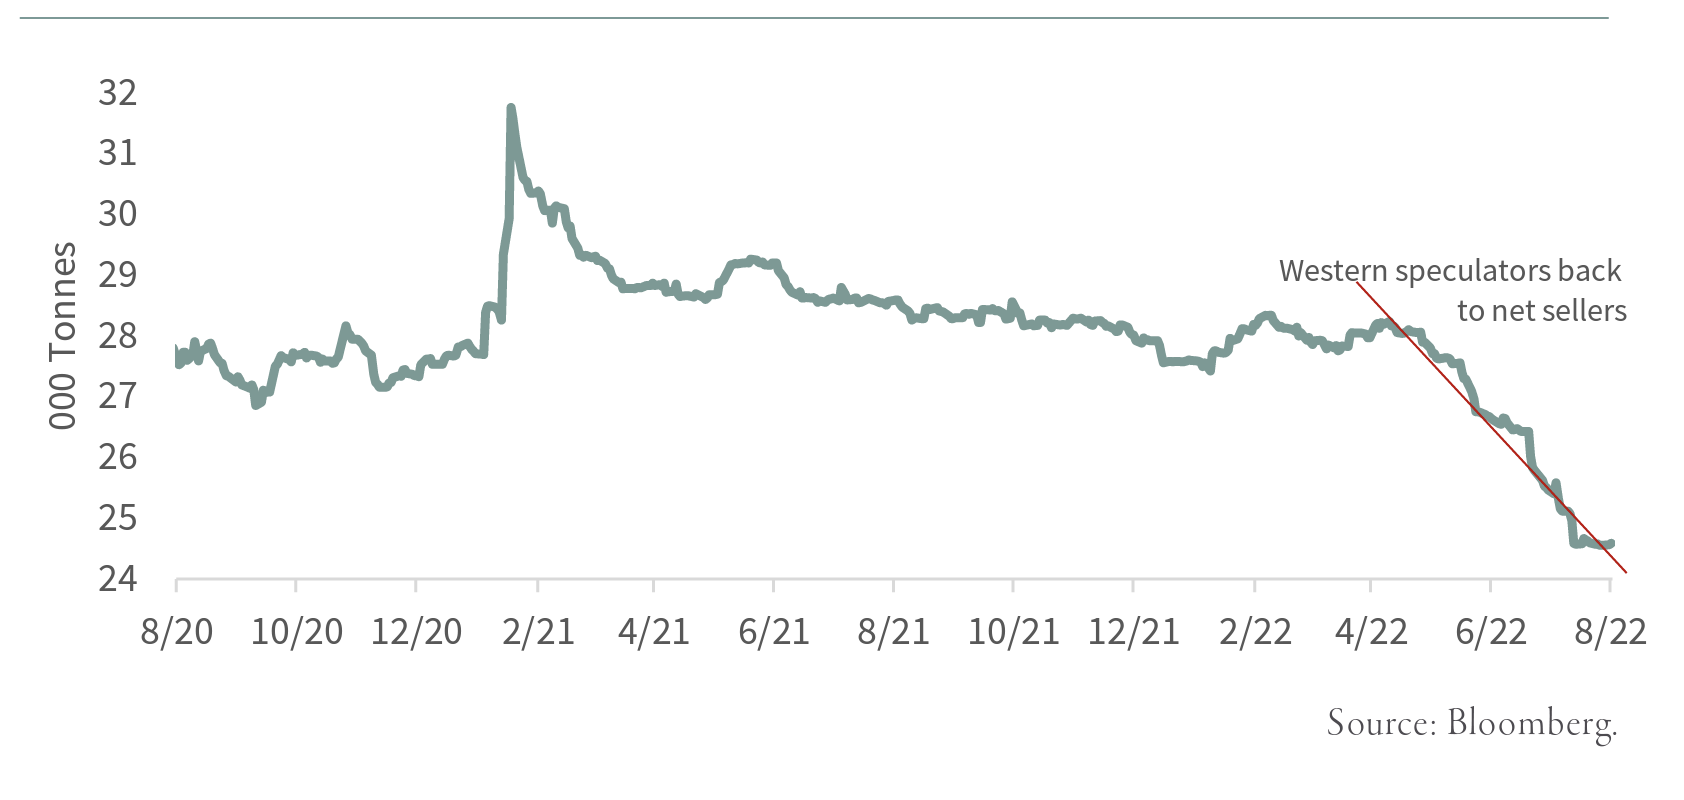
At the end of Q1, we thought westerners had turned from sellers into precious metals buyers, however, the recent behavior in gold and silver ETFs tell us we were wrong. Given the Fed has strongly stated its intension to continue raising short-term rates, and given the continued upward momentum in the dollar, it looks like the western investor has again adopted a bearish stance. The nearly two-year corrective phase in both gold and silver prices has yet to run its course.
Also lending credence that the corrective phase in both gold and silver is not yet over is the behavior now being exhibited by gold traders in the COMEX futures market, although the behavior of silver futures traders is about to flash a potential buy signal.
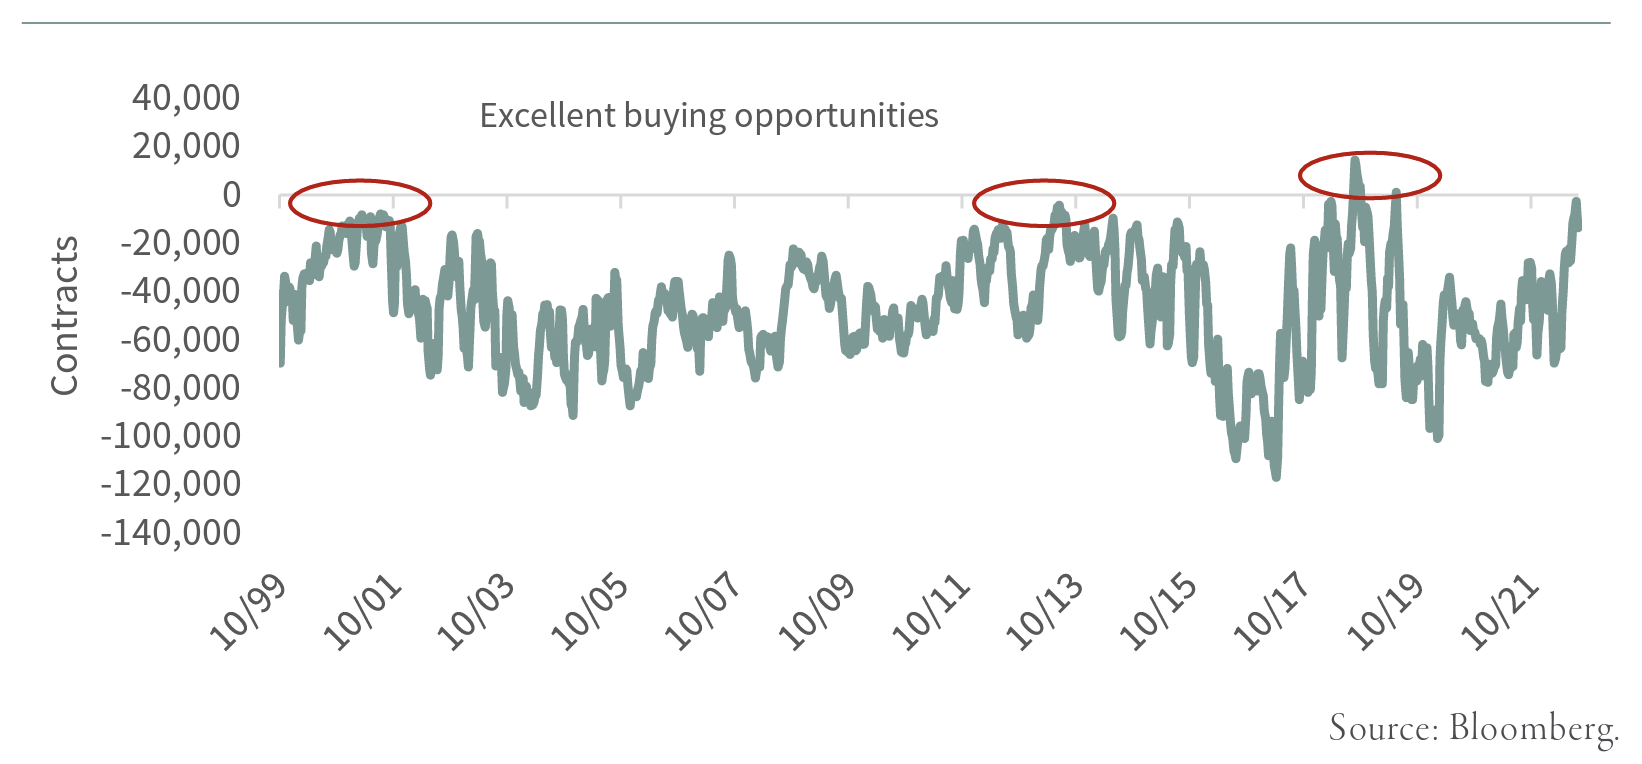
Over the last 20 years, several significant buy signals have been given when commercial gold and silver traders positioned themselves net long and speculative traders went net short. For those who study the positioning of traders in various commodity markets, the “commercials” (i.e., those who use the futures markets to hedge various commercial needs) represent the “smart money.” “Speculators” (i.e., hedge funds, algorithmic traders, and other trend-followers) represent the “dumb” money. Whenever smart money goes net long and dumb money goes net short, that often coincides with a significant bottom in precious metals. It doesn’t happen very often, but when it does, there is a significant buying opportunity.
CFTC COMEX Gold Net Commercial Futures Positions
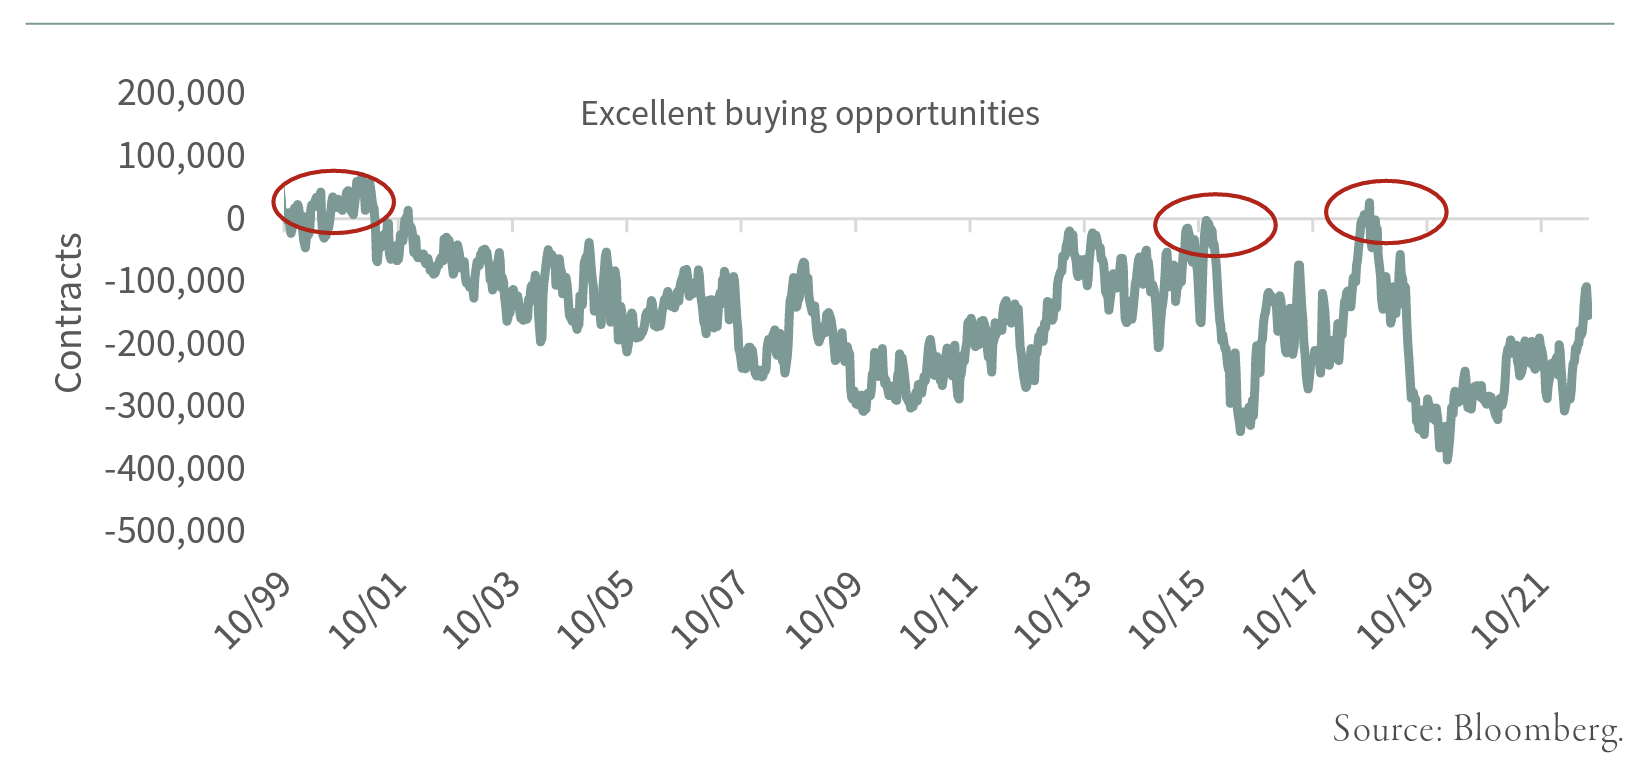
The last time gold and silver commercial traders were long and speculators were short for long periods was back in the late 1990s / early 2000s. Given that gold and silver were incredibly cheap and investors were incredibly bearish (because of the torrent of central bank gold selling), it not surprising that the net long positioning of commercial and net short positioning of speculators for almost four years was telling you that gold represented the buying opportunity of a lifetime. If you had bought gold during these four years, you would have vastly outperformed both the bond and stock markets
Since the massive gold bear market bottom made back in the early 2000s, the instances of commercial traders going long and speculators going short have been few and far between. As you can see, commercial and speculators almost went net long and net short at the end of 2015 just as gold was ending its 45% pullback from its 2011 highs. With gold trading below $1,100 per ounce, that again turned out to be an excellent buying opportunity.
The final instance when gold and silver commercials went net long and speculators went net short occurred back in August 2018. With gold trading below $1,200 per ounce, the positioning of smart and dumb money again gave a great buy signal. Over the next 2 years, gold prices surged over 75%.
Today, the positioning of commercial and speculative gold futures traders is not anywhere close to flashing a buy signal. Even though commercial traders have cut their net short exposure by almost 50% in the last three months, they remain significantly net short. Speculative traders also cut their net long exposure by 50% in the last three months, but they remain 125,000 contracts net long.
Trader positioning in the silver futures market has become far more interesting in the last several months. As you can see from the chart below, commercials have slashed their net short position by almost 90% over the last three months.
CFTC CMX Silver Net Commercial Futures
As silver has pulled back, commercials are on the verge of going net long. As of today, they are only net short 9,600 down from almost 70,000 contracts back in April. Silver market speculators have also significantly cut back on their net long position. As silver has pulled back, speculators have become much less bullish and have cut their net long position from over 50,000 contracts to only 5,400 today—a drop of almost 95%. And just as silver commercial players are on the verge of becoming net long, speculators are on their verge of going net short -- a sign that the two-year corrective phase in silver is coming to a close.
The silver futures market is about to flash a significant buy signal; however the gold market still has not. For those who want to time the ending of the corrective phase in both gold and silver markets, we recommend waiting for commercial to go long in both and for speculators to go net short before significantly increasing their precious metals exposure. When this happened back in August 2018, it turned out to be a great time to significantly increase precious metals exposure.
On the positive side, we should mention that the ratio of gold to oil has flashed another buy signal. When gold gets expensive relative to oil (an ounce of gold buys 30 barrels or more), oil related investments have historically strongly outperformed gold investments. Conversely, when gold gets cheap relative to oil (an ounce of gold buys only 15 barrels or less of oil), then gold related investments have strongly outperformed oil related investments. The last time the gold-oil ratio hit 15 was back in September 2018 (the exact time that COMEX traders had flashed a huge buy signal) when gold traded down to $1,175 and oil prices hit $80. For the next two years, gold and gold related investments radically outperformed oil and oil related investments.
After bottoming in September 2018, gold rose 75% and gold related stocks rose 125%. Over the same two-year period, oil went negative, and oil related equities fell over 60%.
Back on March 8, with oil spiking to $130 per barrel and gold trading down to $1,980, the gold-oil ratio touched 15 intraday, the same level we saw back in September 2018. On June 14, we got another buy signal on the gold-oil ratio. With oil trading at $124 per barrel and gold trading down to $1,805 per ounce, the gold-oil ratio touched 14.6, again in line with the level back in September 2018.
The only difference was that in 2018 the gold-oil ratio buy signal was confirmed by strong buy signals in the positioning of gold and silver COMEX traders as just described above, which has not happened yet.
Given that we have now been given two precious metals buy signals from the gold-oil ratio, the only thing missing from that September 2018 set-up will be the bullish signal flashed from COMEX gold future traders. Will we get a buy signal in the next several months? We are heading in the right direction, and we will carefully monitor their position as we progress through Q3.
Precious metals have now been through almost two years of corrective price action and it has paid handsomely to have minimal exposure over the last two years. Having minimal exposure to investments in the precious metals areas has been a huge positive input to performance over the last two years. However, given that we are strong believers that huge gold and silver bull markets sit directly in front of us, we are carefully monitoring both markets for strong buy signals.
Given the recent pullback in all precious metals investments in the last three months, we have used this weakness to add to our precious metals exposure, however we have now paused before we increase our exposure again.
Intrigued? We invite you to revisit our entire Q2 2022 research letter, Why Resources During a Recession, available below.