Many people don’t realize how far oil prices have climbed over the last two years. The price of West Texas Intermediate (WTI) crude oil has climbed from about $45 in September of 2016 to approximately $70 today. Oil prices surged 14% in the second quarter alone.
Looking forward, we believe oil demand is significantly exceeding supply, and inventories on a global basis should continue to draw (decrease) throughout 2018 and into 2019, which should propel prices even higher.
West Texas Intermediate Oil Prices. Trailing Two Years
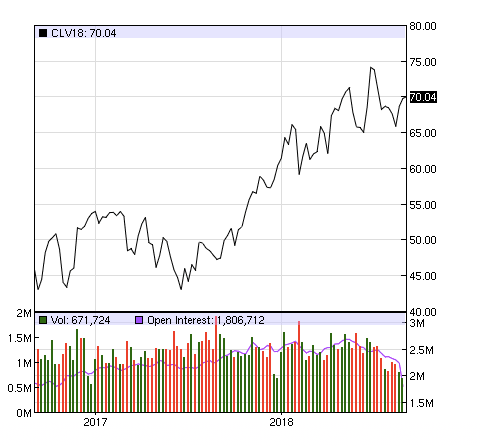
Source: Nasdaq.com
In a letter we published in Q4 2016, we wrote that “oil prices are headed much, much higher.” At the time this seemed like an outlandish prediction: OECD oil inventories (a proxy for global stockpiles) stood at record high levels of ~400 million barrels above seasonal averages while Brent prices were ~$55 per barrel. We explained how global oil markets were much tighter than the market realized and that global inventories would normalize faster than anyone expected.
While few agreed with us at the time, our thesis has played out accordingly since then. In our 3Q 2017 letter, we refined our outlook and predicted that global and US core oil inventories should be within 20 million barrels of seasonal averages sometime in the second quarter of 2018.
Inventory vs. 10-Year Seasonal Averages
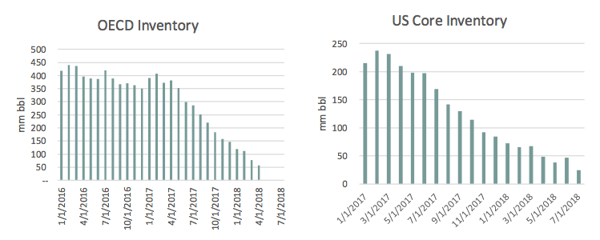
Source: Energy Information Agency (EIA), International Energy Agency (IEA), Goehring & Rozencwajg models
As you can see in the graph above, inventories did reach our approximate target levels during the second quarter. These milestones were thought to be impossible only a few months ago.
Over the last 16 months, OECD inventories have drawn by 635,000 barrels per day relative to seasonal averages – the fastest recorded drawdown since inventory data began. This occurred despite repeated warnings that oil inventories would remain bloated for an extended period of time. As recently as last summer (at which point inventories had already been drawing sharply for six months), investor bearishness remained at extreme levels. As you likely recall, WTI prices collapsed by 20% between April and June 2017 as continued concerns surrounding OPEC cheating and “peak oil demand” (brought about by concerns around electric vehicles) gripped investor psychology. Last summer, we wrote that our models continued to suggest global oil markets were in severe deficit and inventories would continue to draw down further – which is exactly what happened.
The same models that accurately predicted OECD inventory behavior over the last 16 months continue to point to tightness in global crude markets going forward. For the remainder of 2018, the International Energy Agency (IEA) projects global demand will average 99.6mm barrels per day, while total non-OPEC production (including biofuels, processing gains and OPEC NGLs) will reach 67.7mm barrels per day. These figures imply a call (difference) of 31.9mm b/d during the remainder of 2018. However, we believe this figure will be revised significantly higher.
China and India Oil Demand
We continue to believe non-OECD demand is being understated. Based on our emerging market oil demand work (the so-called “S-Curve”), we have long argued the IEA would be forced to revise demand higher. The most notable country going through its “S-Curve tipping point” (the period when oil demand begins to rise much faster relative to real GDP growth) is China, but in our last several letters we explained how India had passed its tipping point as well.
Since the IEA first released estimates for 2018 demand, they have revised both Chinese and Indian demand higher by 130,000 and a staggering 240,000 b/d, respectively. However, we continue to believe more revisions are forthcoming. The reason continues to be the “missing barrels” which have persisted through the first half of 2018. Over the last eight months, the IEA’s “miscellaneous to balance” line item has averaged nearly 500,000 b/d and our models continue to tell us these “missing barrels” will ultimately be accounted for through upward revisions to non-OECD demand.
Furthermore, we believe non-OPEC production outside of the US will continue to disappoint. Between upward revisions to global demand and downward revisions to non-OPEC production outside of the US, we would be surprised if inventories did not continue to draw by at least 500,000 b/d compared to seasonal averages throughout 2018. Such a deficit would take OECD inventories down to dangerously low levels not seen since 2008, which should maintain continued upward pressure on pricing throughout the remainder of the year.