
The article below is an excerpt from our Q1 2023 commentary.
We are using the 1970s as an analog for precious metals this decade. So far, it is proving to be prescient. By 1974, silver had significantly lagged gold for two years and staged a furious catch-up rally. From late 1973 to 1Q74, silver surged 125%. Incidentally, this “catch-up” rally marked the end of the first leg of the great bull market of the 1970s. Over the next two years, gold and silver both fell 45%, while gold stocks collapsed 70%.
We believe the current bull market started in 2018 when gold hit $1160. Silver lagged gold for two years, as it did in the early 1970s, before staging a similar catch-up rally in the summer of 2020. Over the next four months, silver would surge nearly 150%. Just like in 1974, silver’s catch-up was a sign the first leg of the bull move had ended.
In 1974, silver’s correction lasted two years, bottoming in 1Q76. Gold bottomed six months later in August. Silver’s correction lasted two years, bottoming in August 2022, with gold bottoming three months later in November. We are at the equivalent of 1976; the next leg of the bull market is underway.
Interest rate activity was similar in the two periods as well. The Federal Reserve aggressively raised interest rates in the summer of 1973, before the Arab oil embargo. From early 1973 until mid-1974, short-term rates doubled from 7 to 14%. Inflation peaked shortly after at 12% when real rates were positive by 2%. This time, the Federal Reserve raised its funding rate from zero to 5% in a year, and according to the latest inflation data, real rates are again slightly positive.
One noticeable difference between the two periods: the current selloff was much less severe than in the 1970s, despite both periods experiencing material rate increases.
In 1974, gold and silver fell 45% while the stocks fell 70%. This time, gold only pulled back 20%. Silver fell 40%, and the stocks “only” fell 50%. Both precious metals and the associated stocks have also rebounded much faster compared with the 1970s.
Gold and silver stocks are only 15% away from their 2020 peaks, while gold is close to a new all-time high. By comparison, silver took six years to surpass its 1974 high, while the stocks took four years. Despite the surge in short-term interest rates, the correction has turned out to be much less severe than in the 1970s.
We believe central banks explain the difference.
The performance of gold and silver stocks has been remarkable, with only a 15% difference from their 2020 peaks, while gold itself is on the verge of reaching a new all-time high. This is in stark contrast to the 1970s, where it took six long years for silver to surpass its 1974 high, and four years for the stocks to recover. Despite the recent surge in short-term interest rates, the correction has been far less severe this time around. The key factor behind this difference, in our opinion, lies in the actions of central banks.
Our 3Q20 letter highlighted how central banks had stopped buying gold. Between 2019 and 2020, central bank purchases fell from 630 to only 273 tonnes. We warned that gold would remain under pressure if this behavior persisted. In retrospect, we worried needlessly. By 2021, central bank purchases rebounded sharply to 460 tonnes, and by 2022, they surged to 1,140 tonnes – by far the most significant amount over the last seventy years.
Central banks continue to buy aggressively. For the first two months of 2023, central banks purchased over 228 tonnes of gold, an annualized rate of 1,400 tonnes.
China remains the dominant buyer. They purchased twenty-five and eighteen tonnes in February and March, respectively, making it five consecutive months of purchases. China added 120 tonnes, bringing their total reserves to over 2,000 tonnes. While Chinese buying has been prodigious, it still represents less than 4% of total reserves. Singapore purchased forty-five tonnes in January, increasing its holdings by 30% in its largest transaction since 1968. India reentered the market, purchasing seven tonnes in the first quarter compared with seventy-seven and thirty-tree tonnes in 2021 and 2022, respectively.
As we wrote in our essay, “The Coming Change in Monetary Regimes,” a new monetary system will likely emerge this decade. Under this new system, countries will use gold to balance trade differences. For example, everyone paid attention when Brazil announced it would seek to settle agricultural and iron ore trade with China in renminbi instead of dollars. They paid much less attention when Brazil doubled its gold holdings in 2021. Are the two events related? If Brazil holds excess renminbi, will they look to swap the currency for gold, completely bypassing China’s closed capital account? We believe central banks are preparing for a monetary system where they will settle trade imbalances at least partially using gold instead of dollars. This would be explosively bullish for gold. Prodigious money printing has led to current account imbalances that vastly surpass the value of the world’s gold stock.
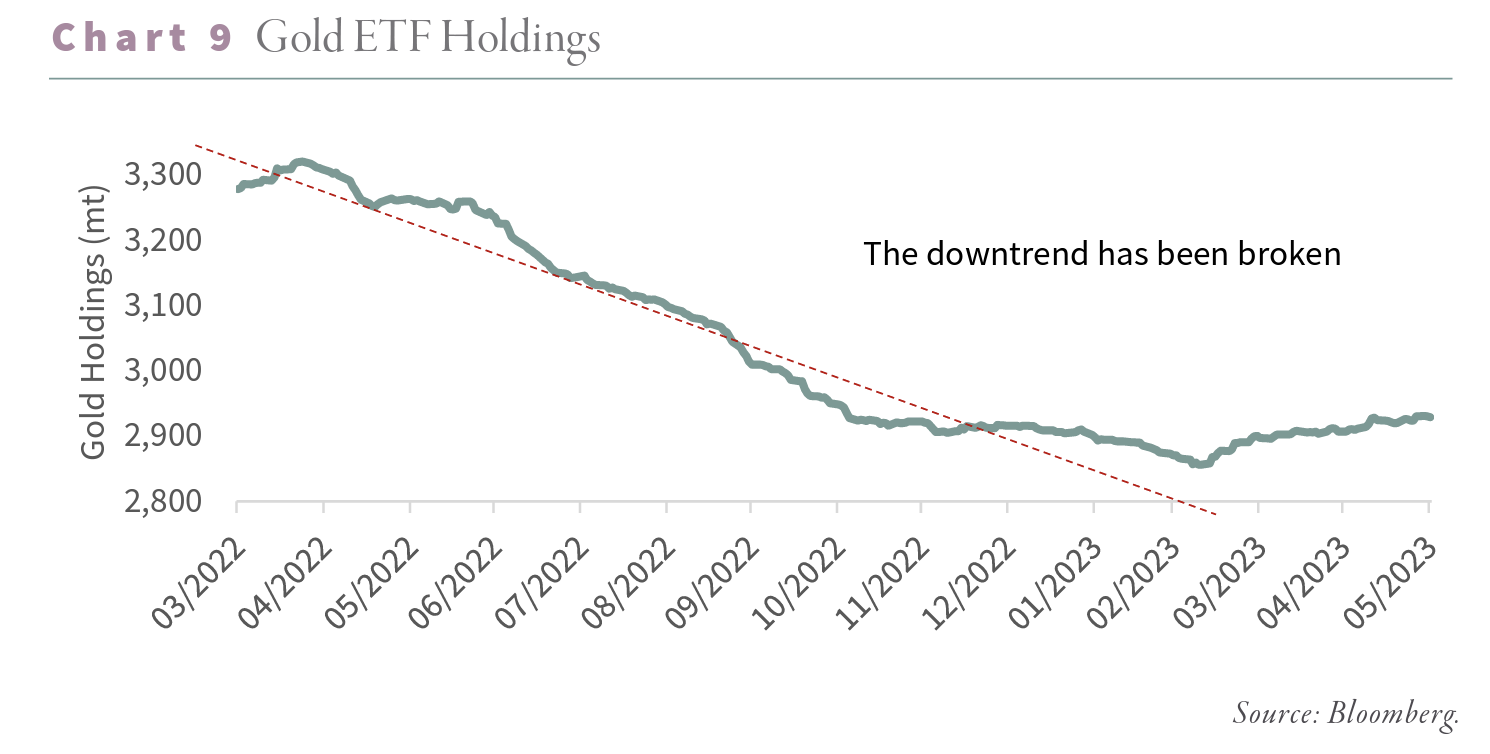
In response to rising interest rates, western speculators shed large amounts of gold over the last two and half years. The eighteen physical gold ETFs we track shed 520 tonnes since late 2020, while speculators have also liquidated substantial paper gold on the COMEX. Since peaking in early 2020, COMEX gold traders have liquidated 350,000 contracts, representing over 100 tonnes of gold. Central bank buying has more than offset the liquidation, explaining why the pullback has been so shallow and the rebound so quick.
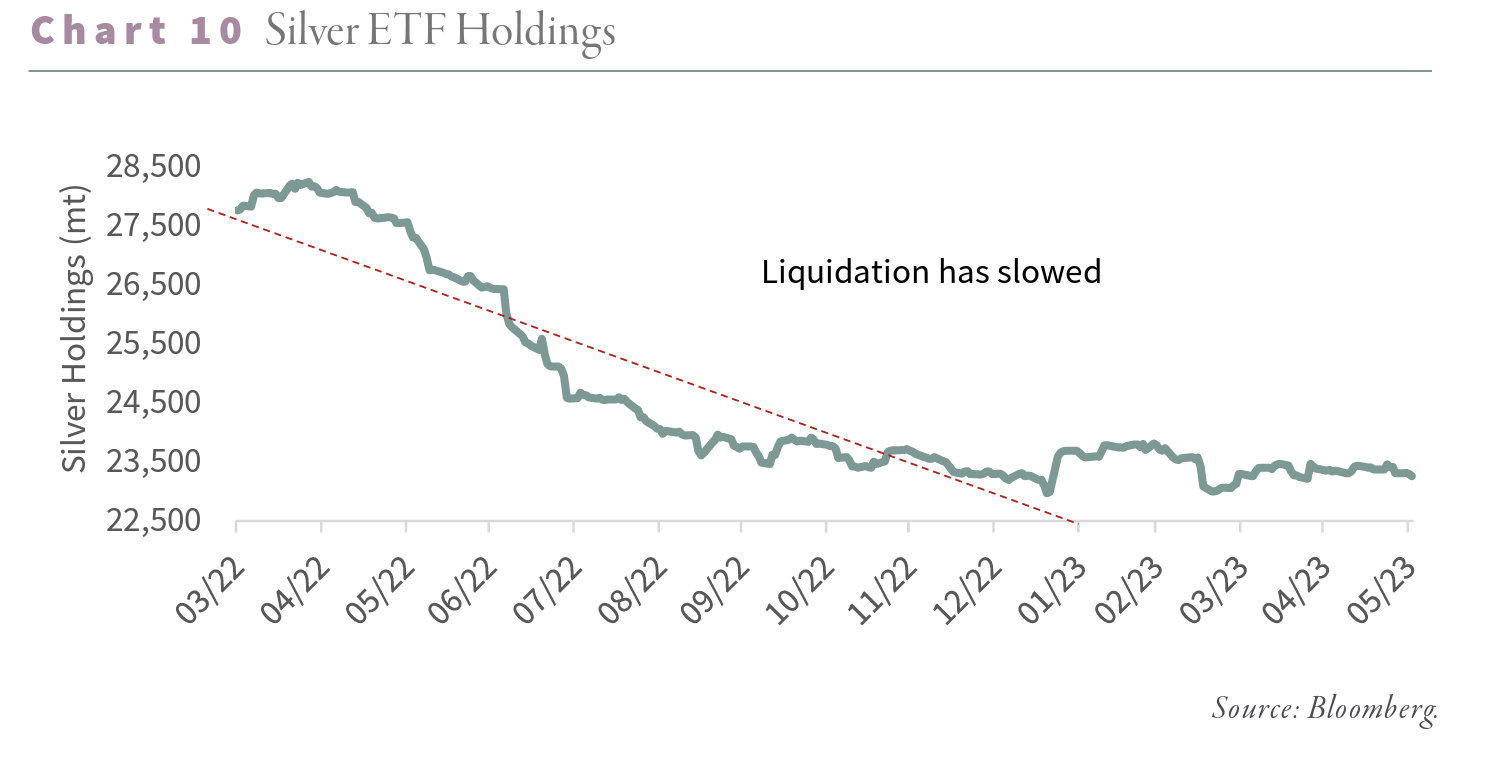
Interestingly, the lack of central bank silver buying explains its ongoing underperformance compared with gold. Peak to trough silver fell almost 40%, rivaling the 1974-1976 drop, and still sits nearly 15% below its 2020 peak. For the corrective phase to last, speculative liquidation must exceed central bank buying. In the previous two and half years, gold speculators liquidated 450 tonnes of gold, yet the price remains near an all-time high. Western speculators have significantly slowed their gold liquidations and are ready to enter a new phase of physical gold accumulation.
Western investors will quickly come into completion with central bank buyers, resulting in a sharp rally. Shedding in the physical silver ETFs is also slowing.
Turning to the positioning of COMEX traders, back in February, they came close to flashing another silver buy signal: speculators went 14,000 contracts net short, and commercials missed going net long by a mere 5,000 contracts. This would have been the second buy signal in the past nine months.
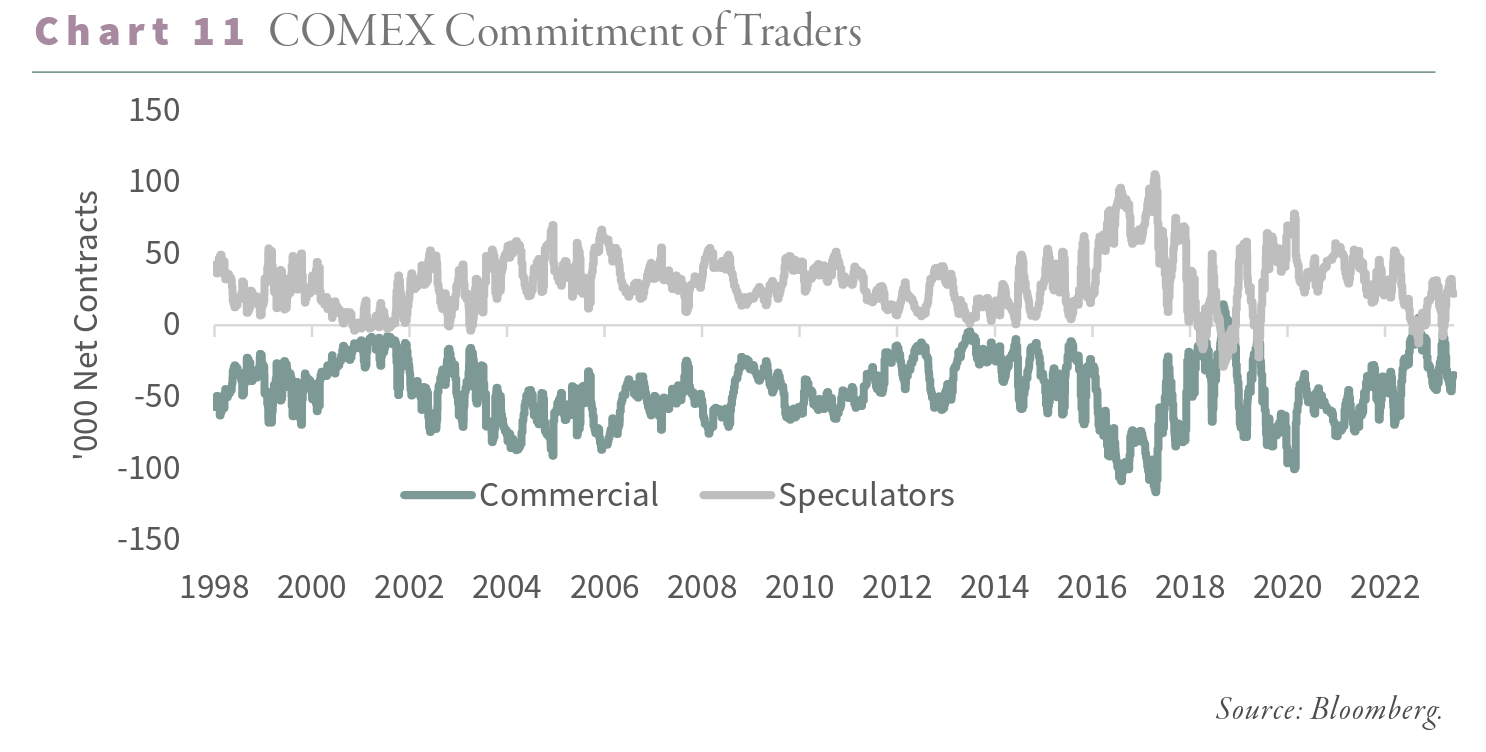
In mid-2018, COMEX traders accurately predicted the upward move in silver to come. We believe, once again, the COMEX is signaling a rapidly approaching sharp upward movement in silver. COMEX gold traders refuse to flash a similar buy signal. In most precious metals bottoms, both gold and silver traders simultaneously flash buy signals (most recently in 2018), and we have been pondering this divergence. The answer, again, is central banks.
Central bank buying has been so strong it has altered the trading patterns of silver and gold traders. Given the lack of any central bank silver buying, net selling pressure in response to raising rates has become far more intense than with gold, where the central banks are buying. The added selling pressure has turned the silver speculators even more bearish. By comparison, gold net selling pressure has been much milder. Central bank buying absorbed most speculative selling. COMEX traders have positioned themselves accordingly. The result is clear: silver traders flashed two buy signals in the last six months, while gold traders flashed none. In past letters, we wrote how COMEX gold traders would provide a buy signal, especially after a sharp pullback. Given the continued strength in central bank buying, we may not get a COMEX speculative buy signal this cycle. The corrective phase might still drag on as the Fed raises rates; however, we are getting close to the next leg of the bull market. If the 1970s analogy holds, the next leg will be explosive.
Intrigued? We invite you to download or revisit our entire Q1 2023 research letter, available below.

Registration with the SEC should not be construed as an endorsement or an indicator of investment skill, acumen or experience. Investments in securities are not insured, protected or guaranteed and may result in loss of income and/or principal. Historical performance is not indicative of any specific investment or future results. Investment process, strategies, philosophies, portfolio composition and allocations, security selection criteria and other parameters are current as of the date indicated and are subject to change without prior notice. This communication is distributed for informational purposes, and it is not to be construed as an offer, solicitation, recommendation, or endorsement of any particular security, products, or services. Nothing in this communication is intended to be or should be construed as individualized investment advice. All content is of a general nature and solely for educational, informational and illustrative purposes. This communication may include opinions and forward-looking statements. All statements other than statements of historical fact are opinions and/or forward-looking statements (including words such as “believe,” “estimate,” “anticipate,” “may,” “will,” “should,” and “expect”). Although we believe that the beliefs and expectations reflected in such forward-looking statements are reasonable, we can give no assurance that such beliefs and expectations will prove to be correct. Various factors could cause actual results or performance to differ materially from those discussed in such forward-looking statements. All expressions of opinion are subject to change. You are cautioned not to place undue reliance on these forward-looking statements. Any dated information is published as of its date only. Dated and forward-looking statements speak only as of the date on which they are made. We undertake no obligation to update publicly or revise any dated or forward-looking statements. Any references to outside data, opinions or content are listed for informational purposes only and have not been independently verified for accuracy by the Adviser. Third-party views, opinions or forecasts do not necessarily reflect those of the Adviser or its employees. Unless stated otherwise, any mention of specific securities or investments is for illustrative purposes only. Adviser’s clients may or may not hold the securities discussed in their portfolios. Adviser makes no representations that any of the securities discussed have been or will be profitable. Indices are not available for direct investment. Their performance does not reflect the expenses associated with the management of an actual portfolio.