Copper equities have pulled back significantly in the last six months and we believe that many offer excellent risk-reward characteristics.
Of all the base metals, copper has pulled back the most on trade-war fears. Not only have we seen a significant liquidation by financial speculators here in the United States, but persistent rumors keep appearing in the financial press regarding significant forced liquidations by various Chinese financiers speculating in global copper markets.
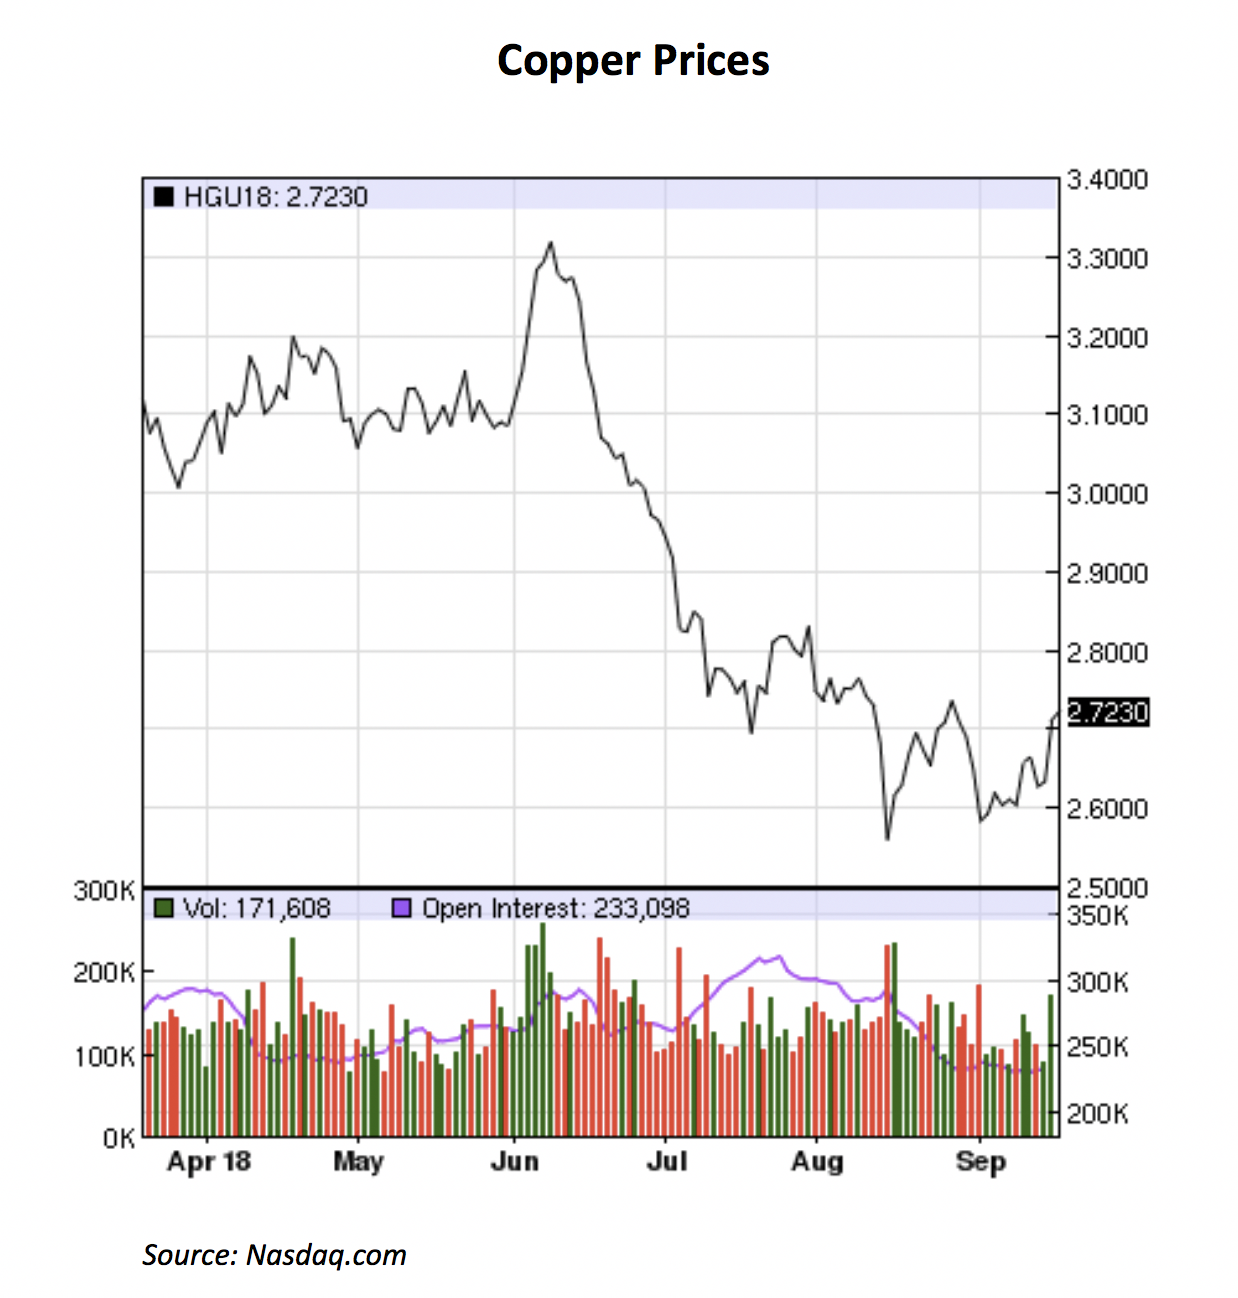
Since peaking at $3.30 per pound in June, copper prices have pulled back significantly.
As mentioned several times in our Q2 2018 letter, we don’t know how this trade war will play out nor how vicious it will get, but we want to outline copper fundamentals as they exist today.
First, global copper demand remains strong, particularly from China. For the first four months of 2018, data from the World Bureau of Metal Statistics (WBMS) shows that after a lackluster 2017, copper demand in China surged 15% year-over-year. The other pocket of copper demand came from India, which also showed a 15% increase in year-over-year demand. We have written that our models indicate India’s copper demand should see years of extremely strong growth and this is what we are most likely beginning to see. Driven by China and India, world copper demand grew by 4.5%, even with flat year-over-year consumption in the OECD world.
On the supply side, world mine supply grew by 4.5% year-over-year, but this represented nothing more than the return of the giant Escondida mine which experienced a 45-day strike in the first quarter of 2017. Escondida, which represents 5% of world mine supply, came back into full production at the beginning of April 2017. Since Escondida’s return, global mine supply has shown no growth. We continue to forecast little growth in global copper mine supply until the large Cobre Panama project commences production in the second half of next year.
Regarding global inventories, exchange-traded inventories (LME, Shanghai, and Comex) have declined significantly since the end of the first quarter. Given our models of mine supply, demand growth, and declining inventories, we believe the copper market today has returned to slight deficit.
Where do we go from here? Today, China represents a little over 50% of total world copper demand. We don’t have much data on how the Trump administration trade tariffs will impact Chinese growth either short- or long-term. The need to build out the electrical grid in China has been by far the largest demand source for copper over the last 20 years. Given China’s stated goal of growing its consumer economy, this source of copper demand will only grow in the future. A July 19th 2018 Bloomberg article succinctly describes the continued need to build out the Chinese electric grid:
“After Winter Heat Crisis, China Braces for Summer Power Crunch.... Parts of China are at risk of shortages as the nation’s distribution networks struggle to cope with soaring temperatures and the fastest power consumption growth in seven years.”
Much of the non-OECD world, most notably China and India, is now squarely in the midst of a period of rapid acceleration in copper consumption. Also, new demand associated with building out the global renewable grid strongly suggests copper demand growth will continue to surprise well into the middle of next decade. Combining strong demand with a mine supply situation that becomes more and more constrained implies to us that the copper bull market still has many years to run. The weakness we are seeing today will, in retrospect, represent a tremendous buying opportunity.
To read our Q2 2018 letter in full, please download it here.