
The article below is an excerpt from our Q3 2024 commentary.
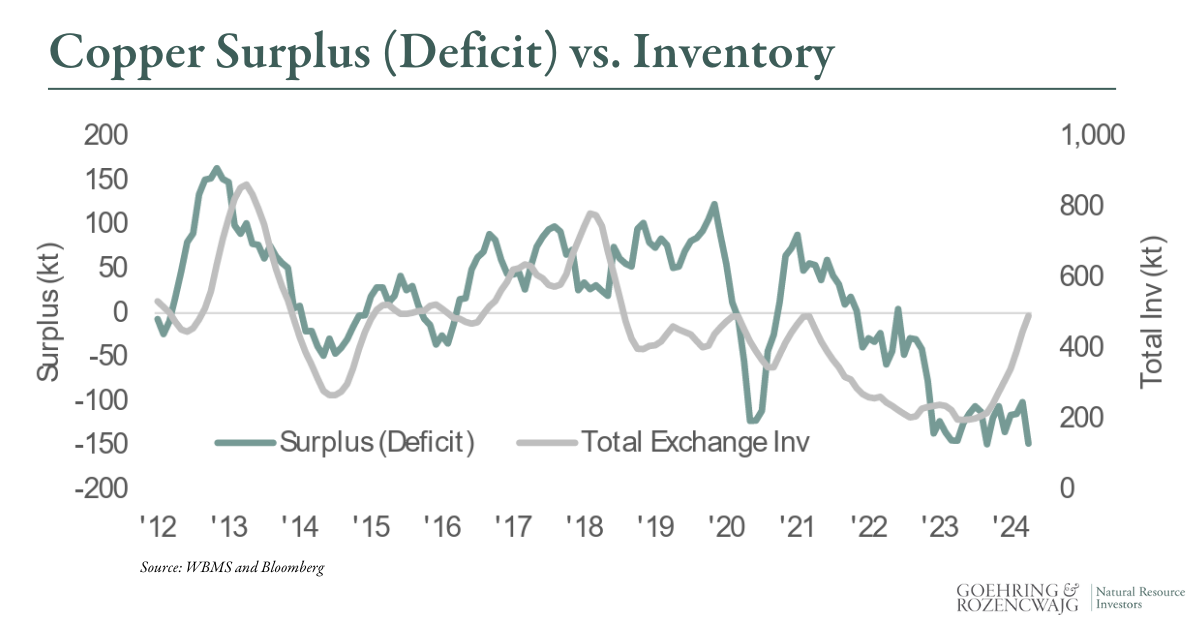
In last quarter's letter, we outlined a rising tide of bearish signals within the global copper market. Chief among them was the growing divergence between our modeling of monthly copper market surpluses and deficits and the behavior of mobilizable copper inventories—those inventories readily shifted into and out of exchange warehouses. While monthly data often carries significant variability, consistent surpluses tend to elevate exchange inventories, whereas sustained deficits typically draw them down.
Beginning in late 2019, our modeling indicated that the global copper market had swung decisively into deficit. Naturally, we anticipated that inventories held at exchanges would begin a prolonged decline.
Indeed, this expectation was realized. After peaking at over 900,000 tonnes in early 2018, exchange inventories—driven by the market’s deficit conditions—steadily shrank to a little over 160,000 tonnes. This extreme tightness triggered the copper short squeeze that rattled the COMEX futures exchange in April and May. Yet, paradoxically, even as our modeling continues to point to persistent deficits, exchange inventories have surged.
As the chart illustrates, exchange inventories have tripled since the short squeeze. The critical question now is whether this surge reflects unexpected demand weakness or some temporary dislocation in copper flows caused by the squeeze itself. Are traders stockpiling inventories as a precaution, wary of being caught in another financial squeeze? It’s a plausible theory—especially given that inventories, after spiking to over 600,000 tonnes, appear to be edging downward again. This trend demands close monitoring.
The latest data from the World Bureau of Metal Statistics (WBMS) confirms that global copper demand remains robust, outpacing supply. Through the first eight months of 2024, copper demand grew by nearly 4%, evenly split between developed and developing economies. Among OECD countries, copper consumption rose a healthy 3.2%, while non-OECD nations—driven by standout gains in Malaysia, Taiwan, Vietnam, and Brazil—saw consumption grow by a remarkable 8.3%.
China, however, tells a more nuanced story. Having posted a 13% year-over-year surge in copper consumption in 2023, growth has decelerated sharply in 2024, with consumption rising just 3% through the first eight months.
On the supply side, the torrid pace of growth in copper output from the Democratic Republic of Congo (DRC) has eased significantly. Mine supply, which was growing at an annualized rate of 6–7% earlier this year, has moderated to around 3% year-over-year growth.
In our last letter, we discussed how China—the dominant driver of copper demand for the past quarter-century—has now entered an era of overconsumption. For years, we rejected the popular narrative that China was consuming copper at unsustainable levels. Our models consistently showed that Chinese copper demand aligned with the nation’s GDP growth and per capita income.
In 2018, for instance, we estimated that China required 196 pounds of invested copper per person to sustain a GDP per capita of $9,600. This estimate exactly matched China’s actual installed copper stock. However, since then, copper consumption has soared above trend. By 2023, China’s copper investment per capita reached 280 pounds—40 pounds above the 240 pounds necessary to support its GDP per capita of $12,100. By the close of 2024, we project this figure will rise to 306 pounds, exceeding the required level by 45 pounds.
This overconsumption is partially explained by China’s massive investments in renewable energy and electric vehicles (EVs). From 2018 to 2024, China added 1,100 gigawatts of renewable power capacity. This boosted China’s copper demand by 15 million tonnes we estimate. Over the same period, the addition of 22 million EVs added another 1.3 million tonnes of copper demand. Even accounting for these “new” sources of demand, however, China has overconsumed by an additional 15 million tonnes in just six years—most of it concentrated in the past two.
As we look toward 2025, it is clear that China has transitioned from underconsuming copper to overconsuming it—a shift with significant implications. This represents another bearish data point in the copper demand story. For 15 years, hedge funds and market analysts speculated endlessly about China’s supposed overconsumption of copper. Ironically, now that the overconsumption is real, the copper analytics community remains conspicuously silent.
In the near term, global copper market trends remain bullish. However, emerging signs—like China’s overconsumption—suggest a less favorable long-term outlook. These developments warrant close scrutiny as we assess the evolving dynamics of the copper market.
Curious to learn more? Read more in our Q3 2024 research newsletter, available for download below.

Registration with the SEC should not be construed as an endorsement or an indicator of investment skill, acumen or experience. Investments in securities are not insured, protected or guaranteed and may result in loss of income and/or principal. Historical performance is not indicative of any specific investment or future results. Investment process, strategies, philosophies, portfolio composition and allocations, security selection criteria and other parameters are current as of the date indicated and are subject to change without prior notice. This communication is distributed for informational purposes, and it is not to be construed as an offer, solicitation, recommendation, or endorsement of any particular security, products, or services. Nothing in this communication is intended to be or should be construed as individualized investment advice. All content is of a general nature and solely for educational, informational and illustrative purposes. This communication may include opinions and forward-looking statements. All statements other than statements of historical fact are opinions and/or forward-looking statements (including words such as “believe,” “estimate,” “anticipate,” “may,” “will,” “should,” and “expect”). Although we believe that the beliefs and expectations reflected in such forward-looking statements are reasonable, we can give no assurance that such beliefs and expectations will prove to be correct. Various factors could cause actual results or performance to differ materially from those discussed in such forward-looking statements. All expressions of opinion are subject to change. You are cautioned not to place undue reliance on these forward-looking statements. Any dated information is published as of its date only. Dated and forward-looking statements speak only as of the date on which they are made. We undertake no obligation to update publicly or revise any dated or forward-looking statements. Any references to outside data, opinions or content are listed for informational purposes only and have not been independently verified for accuracy by the Adviser. Third-party views, opinions or forecasts do not necessarily reflect those of the Adviser or its employees. Unless stated otherwise, any mention of specific securities or investments is for illustrative purposes only. Adviser’s clients may or may not hold the securities discussed in their portfolios. Adviser makes no representations that any of the securities discussed have been or will be profitable. Indices are not available for direct investment. Their performance does not reflect the expenses associated with the management of an actual portfolio.