
The article below is an excerpt from our Q3 2023 commentary.
“It is a confusion of ideas to suppose that the economical use of fuel is equivalent to diminished consumption. The very contrary is the truth.”
William Stanley Jevons, The Coal Question, 1865
The emergence of the “Magnificent Seven” has dominated all investment thinking. Owning these seven mega-cap growth stocks has become mandatory for survival in today’s investment world. These seven stocks alone now constitute almost 30% of the S&P 500’s weighting and advance daily in price.
Waking up after a fitful night’s sleep, dominated no doubt by worries over underperformance tied to being underweight this group, a portfolio manager gazing into the mirror, might debate what “Magnificent Seven” stocks must be purchased the coming day.
“NVIDIA has pulled back a little here; the stock is expensive here, but everyone agrees AI will be taking over the world….” On the other hand, they muse: “ Microsoft looks a bargain at only 30x earnings [only twice its long-term earnings growth!] and aren’t they doing AI too—look, they just hired that AI guru from chatGPT to run their AI business ?” Then again, “Meta’s multiple is below its estimated growth rate and thankfully, Mr. Zuckerberg has stopped wearing those silly glasses—isn’t the Metaverse just another form of AI?” Or maybe Amazon: “Now there’s a great way to play AI—even though the stocks trade at a PE of 40, everyone forgets that almost all their earnings come from server farms and cloud computing—remember: you want to own the retailers of picks and shovels, not the miners—I think my grandfather told me that.” Google and Apple are also considered. Ultimately, our sleep-deprived investor considers Tesla – maybe both the stock and the product. “After all, the IEA reiterated how EVs are taking over the world. Everyone in my neighborhood has a gleaming $100,000 Model S – one certainly does not want to be left out. It’s settled then: today, I buy Tesla—both the car and the stock.”
Seldom, if ever, would our investor think about energy.
If our hypothetical investor were to think about energy (doubtful), it would likely be from the short side. Traditional energy sources are already on the funeral pyre, at least according to the gloomy World Energy Outlook 2023 released by the IEA (International Energy Agency). The appetite for oil, gas, and coal investments has supposedly peaked. The new kings – renewables -- are expected to be crowned before this decade ends. Why invest in a sector with such a dismal outlook? Adding to one’s (already overweight) Amazon position is far easier. All growth, all good! Energy stocks--with their bleak prospects—garner zero interest.
Unfortunately, our hypothetical investor is not alone. The market’s enthusiasm for energy stocks remains negative. Despite outpacing tech stocks since March 2020, energy stocks account for less than 5% of the S&P 500, well below the 14% historical average.
Looking at the outstanding shares of energy stock ETFs, we can see that investor interest continues to fall. The preferred ETFs (XLE, XOP, and OIH) have all significantly shrunk their share counts over the past two years. Despite being the star performer, energy investments are more related to short covering than sustained investor buying—which just doesn’t exist. In contrast, investors continue to add to mega-cap tech positions. Despite last year’s 35% drop in the NASDAQ composite, open interest in the QQQ ETF (which tracks the Nasdaq 100 Index) has increased by 20%.
The imagined struggle of the institutional investor closely mirrors reality. The consensus call is to pile onto tech stocks. Any remaining energy investments must be promptly sold to fund further purchases of the QQQ. It’s better to sell now than be stuck later.
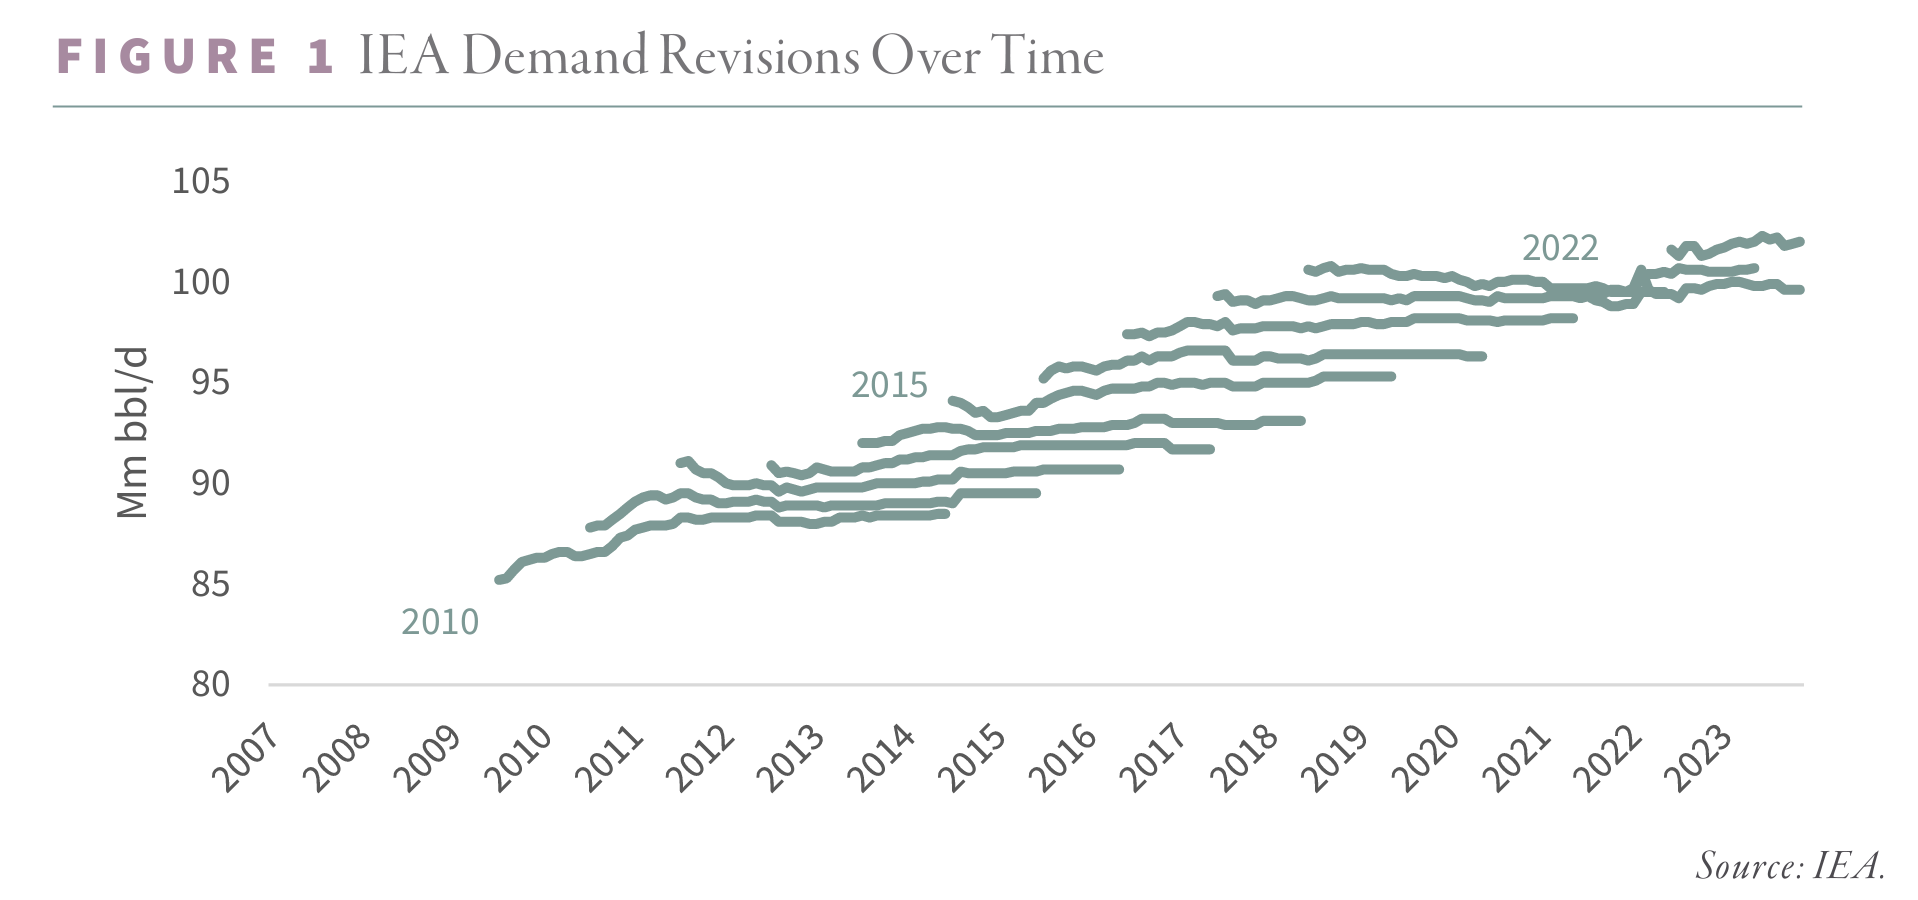
But what if the opposite scenario unfolds? What if the IEA projections have erred and energy demand continues to surge in the coming years? After all, the IEA has a history of being ridiculously pessimistic in its demand forecasts. The agency has underestimated demand in 12 of the past 14 years by an impressive 820,000 b/d on average (excluding COVID-impacted 2020).
As we will discover in this essay, the IEA’s flawed methodologies persist. Analysts who revere the IEA’s forecasts are also prone to these errors. Case in point – LNG analysts have consistently undershot demand predictions since 2010. Projections of surging supply outpacing demand and breaking LNG’s historical oil-linked price have fallen flat, with demand often exceeding expectations.
Historically, producers sold LNG under long-term contracts with a price linked to crude oil. By the late 2000s, traders established a robust spot market. Most pundits believed that surging supply would overwhelm demand while a freely trading spot market would break LNG’s historical oil-linked price. The most bearish argued that prices would ultimately fall to LNG’s marginal cost of $1 per MMBtu supplied by low-cost Qatari gas. Despite their cries, the bearish case never materialized. Stronger-than-expected demand absorbed the new supply (much of it from Australia and the US), and the spot market rarely deviated from the 6:1 oil price link. Experts again significantly underestimated demand.
Our prediction contradicts the conventional narrative – we believe energy demand will continue to beat expectations well into the next decade. This presents considerable investment implications. The widely accepted belief that demand will peak sends investors scrambling to sell their existing energy positions. The recent IEA’s bleak World Energy Outlook only reinforces this perspective. We, however, believe that demand will maintain its upward trajectory.
When the realization dawns that oil and gas demand is not in free fall, investors will be forced to confront how little the industry has invested to offset declines. According to our modeling, global oil markets have already fallen into a “structural deficit” masked by massive releases from government-controlled strategic stockpiles.
Such an awakening will stun investors, whose energy exposure hovers near zero. Thus, the day will soon come when that same investor stands before the mirror preparing for the day and says: “Today, I must buy energy shares -- a lot.”
THE JEVON’S PARADOX WAS BORN: IMPROVED EFFICIENCY INCREASES CONSUMPTION.
While every investor is familiar with Moore’s Law (often misapplying it to areas such as the cost of renewable energy), hardly anyone knows about the Jevons Paradox. They would be wise to learn. In 1865, an English economist, William Stanley Jevons, detailed his eponymous Paradox in his book The Coal Question. Jevons noticed how improved steam engine efficiency actually led to much greater coal demand. At the time, economists were worried that England was running out of coal. Many argued that improved efficiency would temper demand and forestall a crisis. Jevon dismissed this logic, correctly concluding that improved efficiency would accelerate demand by promoting increased adoption. Jevon’s Paradox was born: improved efficiency increases consumption. The mechanics were two-fold. First, better efficiency encourages more significant use. Secondly, as the same input unit generates more output, economic growth accelerates, increasing overall consumption. Although Jevons’ work dramatically advanced micro- and macroeconomics, the world has abandoned his invaluable lessons entirely. This does not make them any less relevant.
For decades, we have been fascinated with energy demand. Unlike supply, which is much more tangible, predicting demand is an abstract exercise. Analysts model supply, tally reserves, count rigs, and total capital spending. With demand, we must ponder how societies develop, regions urbanize, and individuals consume. And yet, getting demand right has never been more critical.
While many clients we meet with understand the absence of resource capital and the resulting supply shortages, they cannot invest owing to their worries about demand. In the near term, they are concerned about an impending recession. In the long term, they worry about “peak demand.” We vehemently disagree with both. So long as investors fail to appreciate Jevons’ lessons, demand will constantly surprise to the upside. Educated investors stand to benefit tremendously.
Three real-world examples help breathe life into the Jevons Paradox. First, while the average fuel economy of modern automobiles has surged in recent decades, gasoline demand never faltered. Motorists instead chose to drive larger SUVs and drive much further. Second, the energy required to heat and cool a home has collapsed as more efficient windows and HVAC systems have proliferated. Homeowners have taken the savings and doubled the size of the average American home, offsetting any efficiency gains. Finally, as we write this essay, we are aboard an Airbus A350-ULR en route to Singapore. The 9,500 mile journey is made possible by the highly efficient Rolls-Royce Trent XWB-97 engine, which consumes 25% less fuel compared with the previous engines. Once again, instead of reducing jet fuel demand, passenger miles have skyrocketed in recent years, resulting in record demand.
EXCLUDING 2020, THE IEA INCREASED DEMAND BY AN INCREDIBLE 800,000 B/D ON AVERAGE FROM ITS INITIAL EXPECTATION. IF THE IEA’S ERROR WERE A COUNTRY, IT WOULD BE THE WORLD’S 21ST LARGEST OIL CONSUMER.
The IEA is leading the bearish chorus. In their most recent World Energy Outlook 2023, published in October, the IEA lays out its “Announced Pledges Scenario” for global energy demand. Between 2022 and 2030, the IEA estimates demand (which it oddly calls Total Energy Supply [TES]) will fall by 1%. By 2040, it will fall by 3.2%. These numbers are not possible given our understanding of global energy consumption. Our models tell us the IEA uses fundamentally flawed mythologies that introduce a systematic downward bias. Their bias has been apparent since at least 2010. Over that time, the IEA has chronically underestimated global oil demand in twelve of the fourteen years (including COVID-impacted 2020). Excluding 2020, the IEA increased demand by an incredible 800,000 b/d on average from its initial expectation. If the IEA’s error were a country, it would be the world’s 21st largest oil consumer.
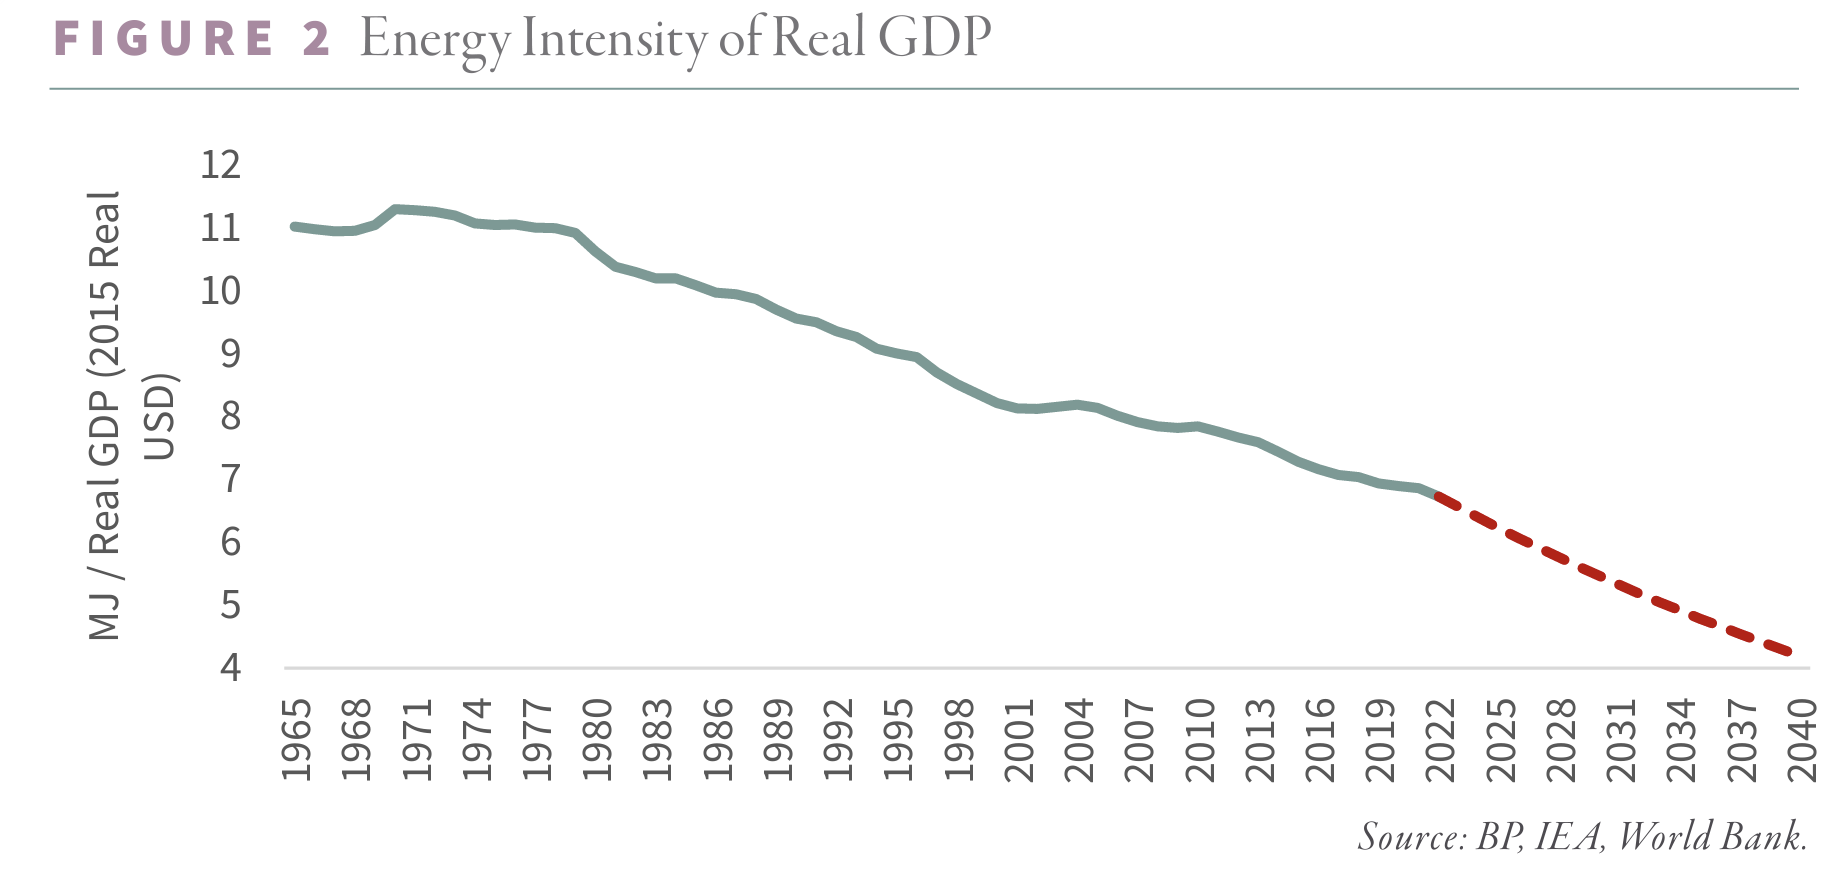
We believe the IEA’s error stems from its faulty understanding of energy intensity (the inverse of efficiency). Energy intensity, defined as Total Energy Supply per dollar of real GDP, has improved dramatically over the last six decades. In 1965, it took 13 megajoules (MJ) to generate one US dollar of real GDP. By 2022, the same real dollar required less than 7 MJ – a reduction of nearly 40% or almost 1% per annum. The IEA expects these trends will accelerate dramatically. Based on their projections, energy intensity will take only seventeen years to fall as much as it did over the past six decades. From 7 MJ today, the IEA expects a dollar of real GDP will only require 4 MJ by 2040 – an incredible decline of nearly 3% annually.
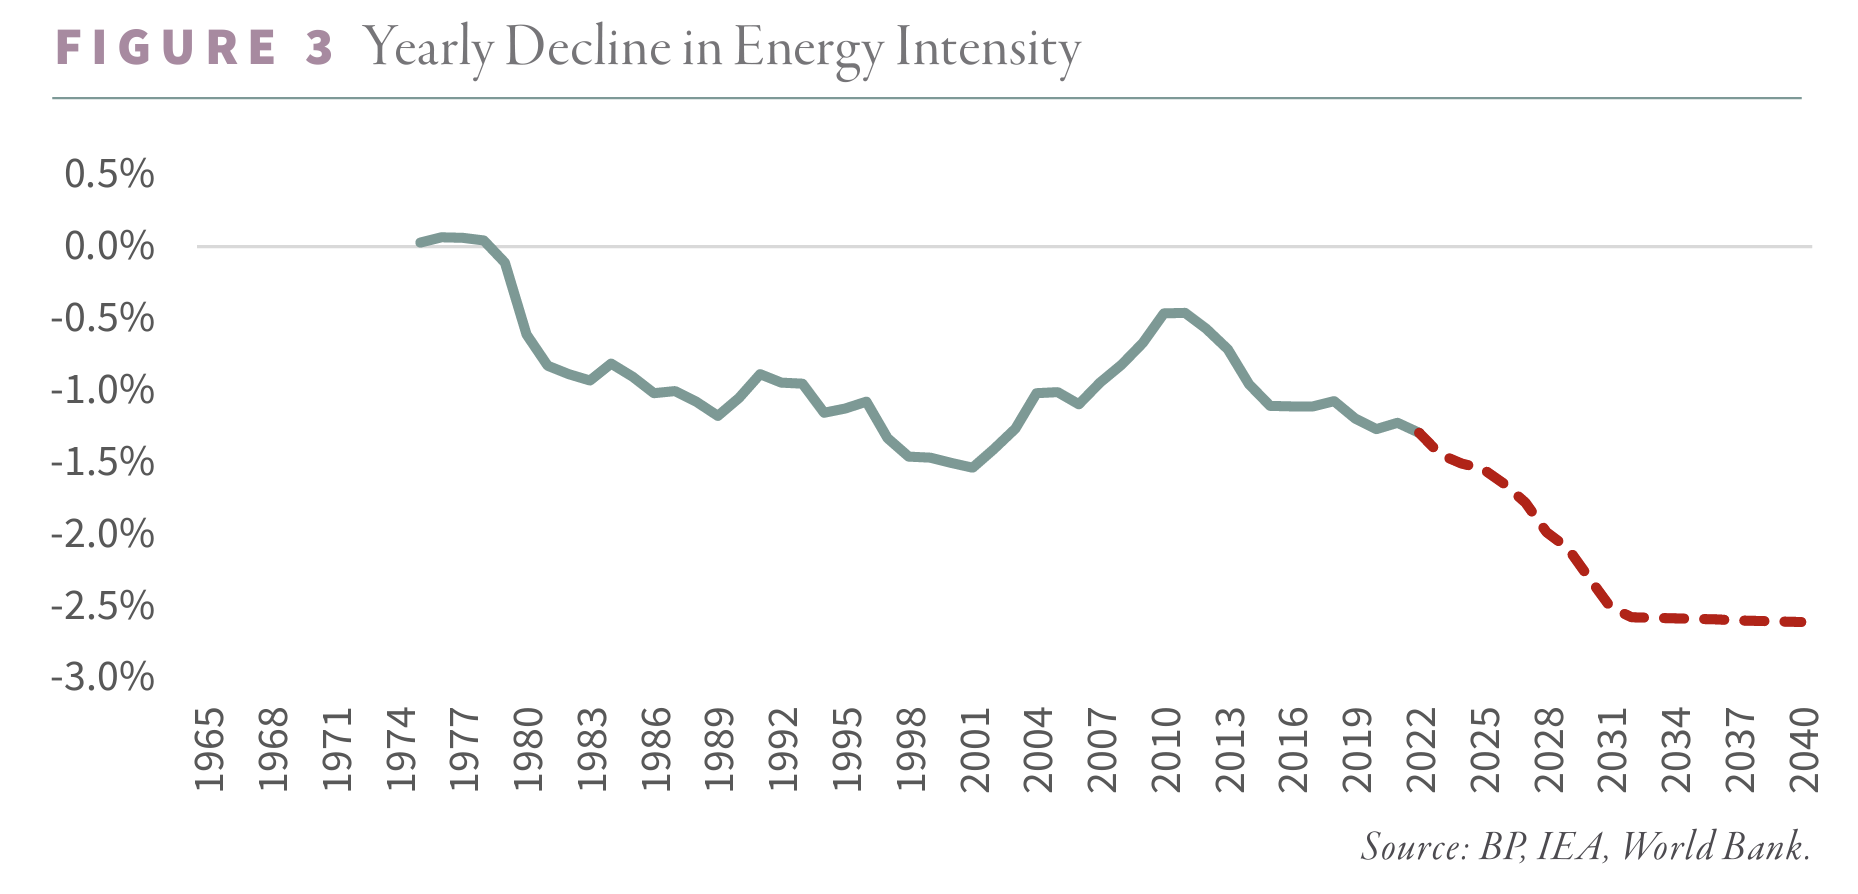
The IEA’s analysis has three critical flaws. First, while the chart above seems to reflect a reasonable extrapolation, it implies a massive acceleration in efficiency gains. From 1980 to 2022, on a 10-year rolling basis, energy intensity improved by approximately 1% per year. The IEA assumes this improvement accelerates nearly three-fold – something we believe is impossible.
Second, the IEA’s projections fly squarely in the face of the Jevons Paradox. Over the past six decades, although (or indeed because) energy efficiency improved by 40%, energy demand per capita nearly doubled while total energy demand rose four-fold. According to the IEA, over the next seventeen years, a similar 40% improvement in efficiency will lead to a nearly 15% decline in per capita demand and a 3% decline in total demand. Never in human history has improved efficiency resulted in less demand – the coming two decades will be no different.
Third, the IEA fails to account for recent memory’s most significant growth driver: the rise of emerging markets. At any given moment, global energy intensity is the aggregate of countless smaller markets, each with wildly different needs. Although one dollar of real GDP requires 7 MJ globally, China (and most emerging economies) takes nearly 10 MJ, while the US (and most of the developed world) takes less than 5 MJ. While every country has become more efficient over time, the difference between emerging and developed economies remains stark. Global energy intensity is the sum of each country, weighted by its proportion of global real GDP.
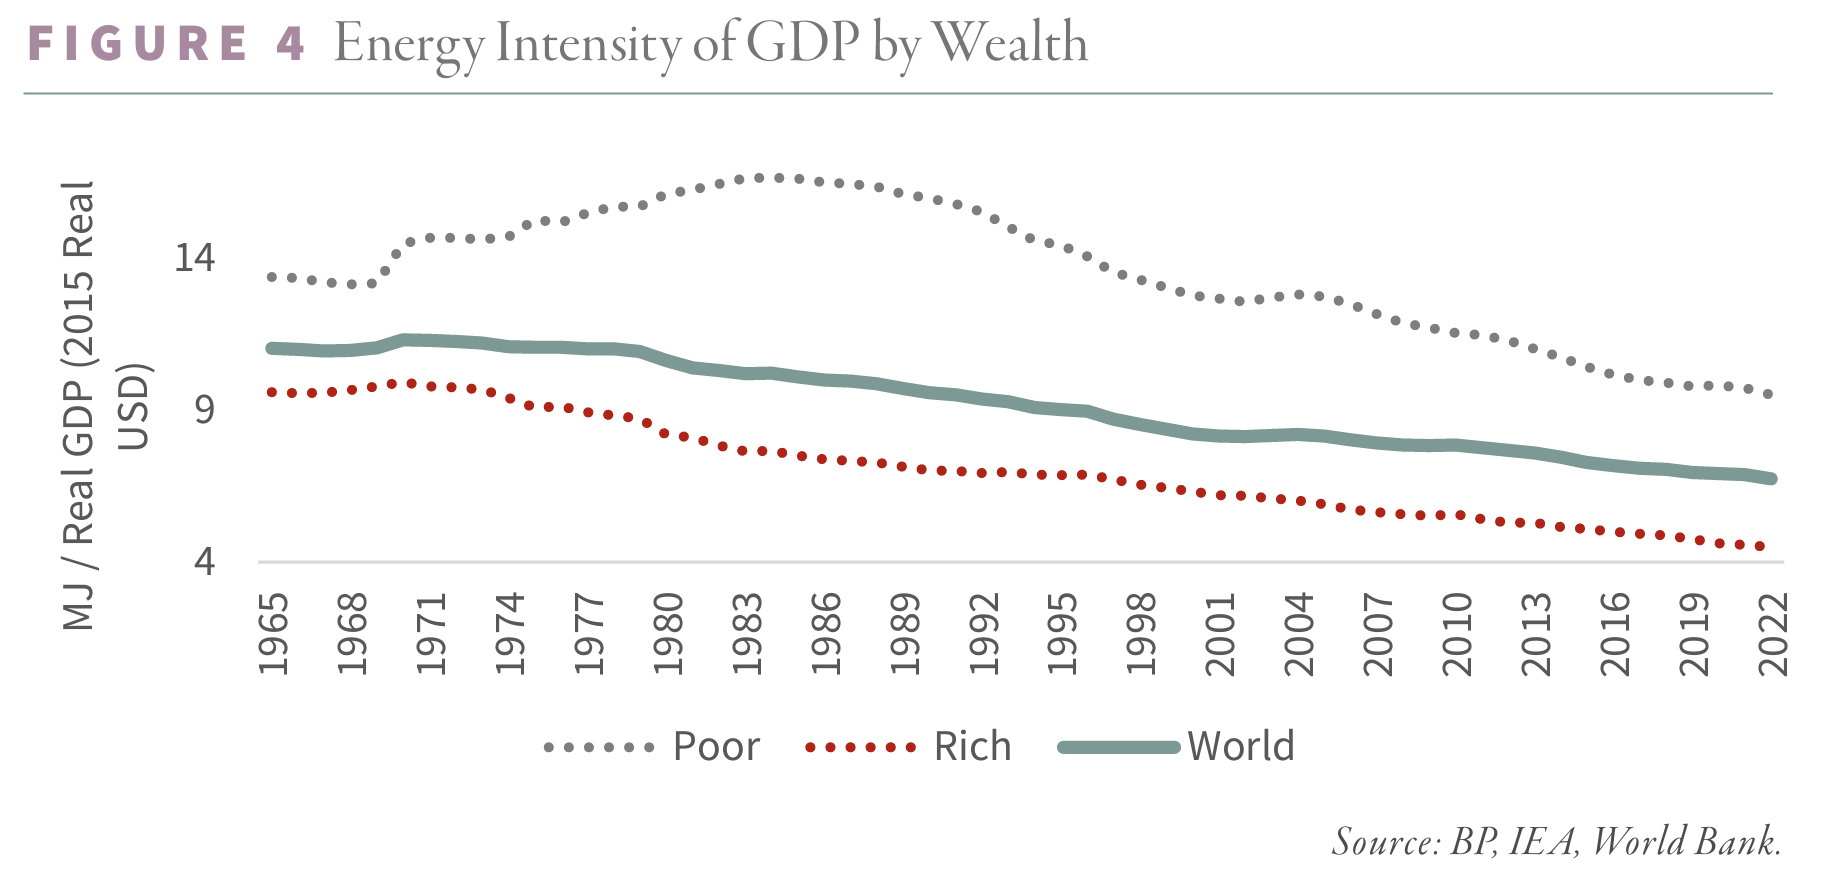
For decades, emerging markets represented a low and constant share of global GDP. In 1970, poor countries represented 30% of real GDP; 35 years later, little had changed. A significant shift occurred around 2005 as numerous Asian countries entered a period of accelerated economic growth. By 2022, poor countries had gone from 30% to 45% of global real GDP and will soon exceed 50%. Emerging markets have been even more impactful as a proportion of total growth. Despite representing only one-third of global output, emerging markets delivered two-thirds of all growth since 2005.
WITH MORE GROWTH FROM ENERGY-INTENSIVE ECONOMIES, GLOBAL ENERGY PER DOLLAR OF REAL GDP SHIFTED HIGHER THAN EXPECTED.
With more growth from energy-intensive economies, global energy per dollar of real GDP shifted higher than expected. For example, although energy intensity in developed and emerging markets fell by a quarter between 2005 and 2022, global intensity fell by only 17%. Had emerging markets remained at only one-third of global output instead of growing to 45%, total energy demand would be nearly 10% lower than it is today. Just as emerging markets started to become a more significant source of growth (between 2005 and 2010), the IEA started chronically underestimating demand.
The IEA’s error is about to get much worse. By 2040, emerging markets will go from 45% to 53% of global GDP, representing nearly 70% of all growth. Despite this accelerating shift towards more energy-intensive economies, the IEA predicts global intensity will fall by nearly 40% -- twice the improvement compared to the last seventeen years. For this to be possible, emerging-market energy intensity would have to fall by 50%, and per capita demand would have to fall by 10%, doubling per capita income. The Jevons Paradox teaches this is not possible: even if the efficiency gains were achievable, economic output would accelerate, more than making up the difference.
Our demand models are fundamentally different. We believe economic development drives energy demand, and our models capture that relationship explicitly. The result is our S-Curve demand model, where we plot per capita energy demand against real GDP. When an economy is very poor, it consumes little energy; any growth goes towards subsistence. As it reaches middle-income, its energy demand grows materially. Finally, energy demand begins to flatten at $20,000 of real per capita GDP.
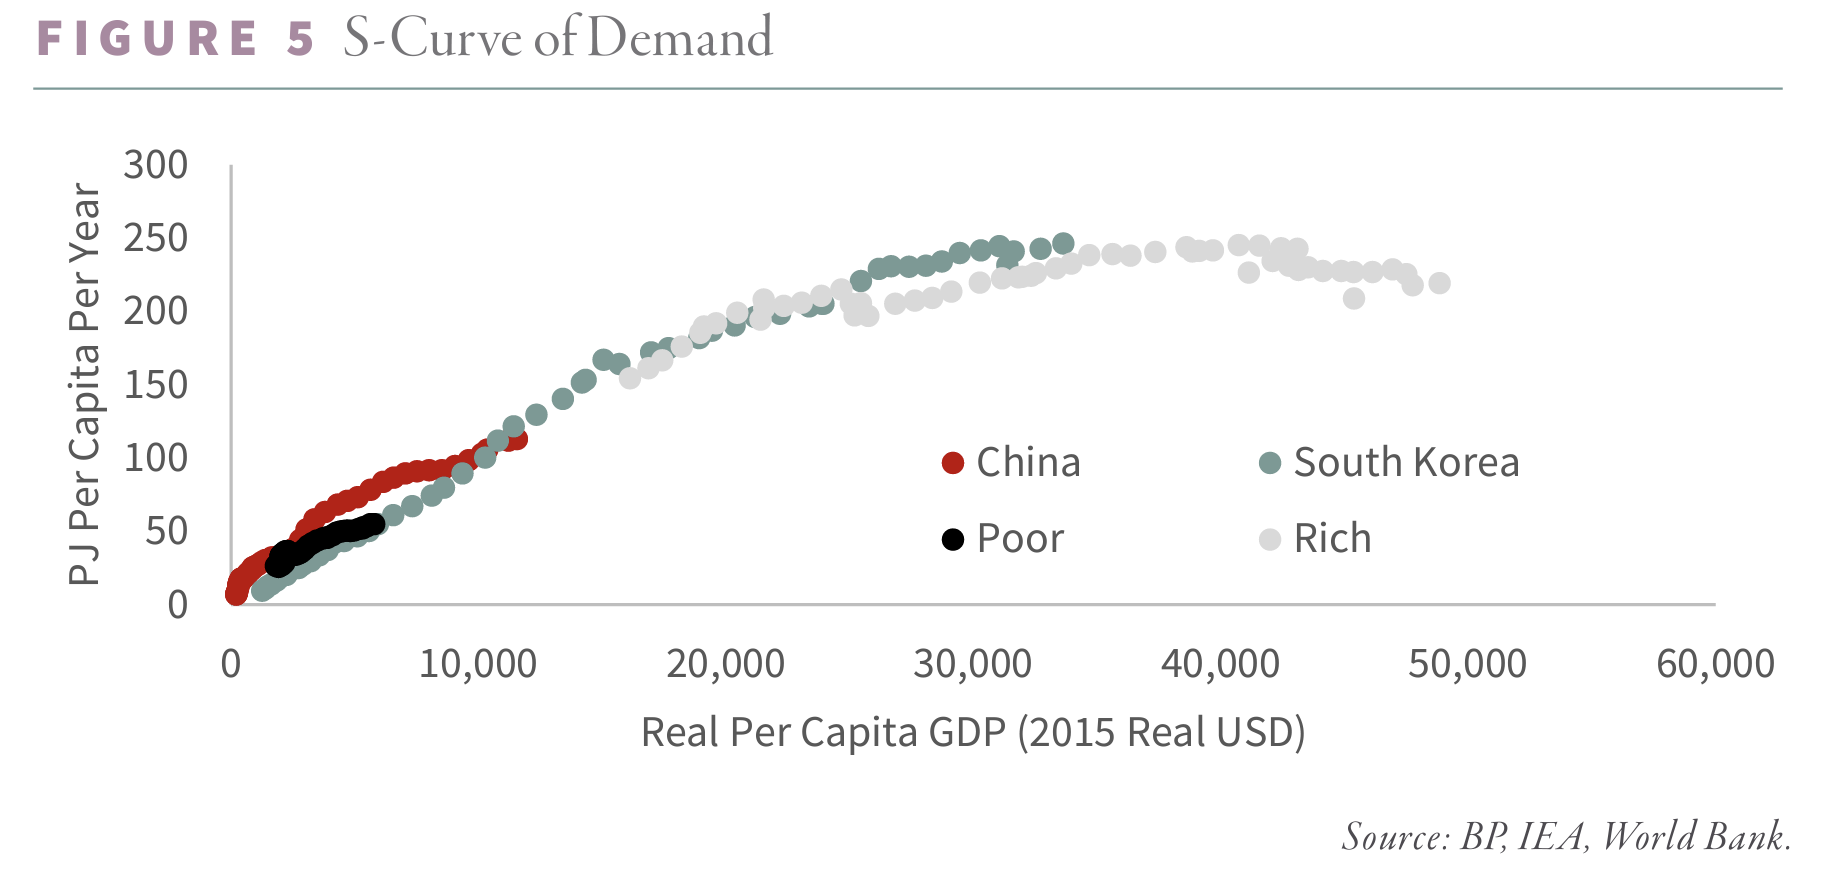
Our S-Curve holds well across different regions and times. In 1965, South Korea had a $1,300 real per capita GDP and consumed 9.4 petajoules (PJ) per person. By 2010, Korean GDP had grown to $25,000, while energy demand reached nearly 220 PJ per person. Four decades earlier and an ocean away, US real GDP hit $23,000 while energy demand was 250 PJ per person – remarkably similar. China currently sports a real GDP of $12,000 and consumes 113 PJ – comparable to Korea in 1994 in terms of GDP and energy demand. For China to exit the middle-income trap and top $20,000 per capita, the S-Curve suggests its energy demand must grow by at least 60%.
Once an economy reaches $20,000 per capita, energy demand still grows, albeit much slower. After $40,000 per capita, the economy is mainly saturated, and energy demand stays essentially flat, with efficiency gains offsetting economic growth.
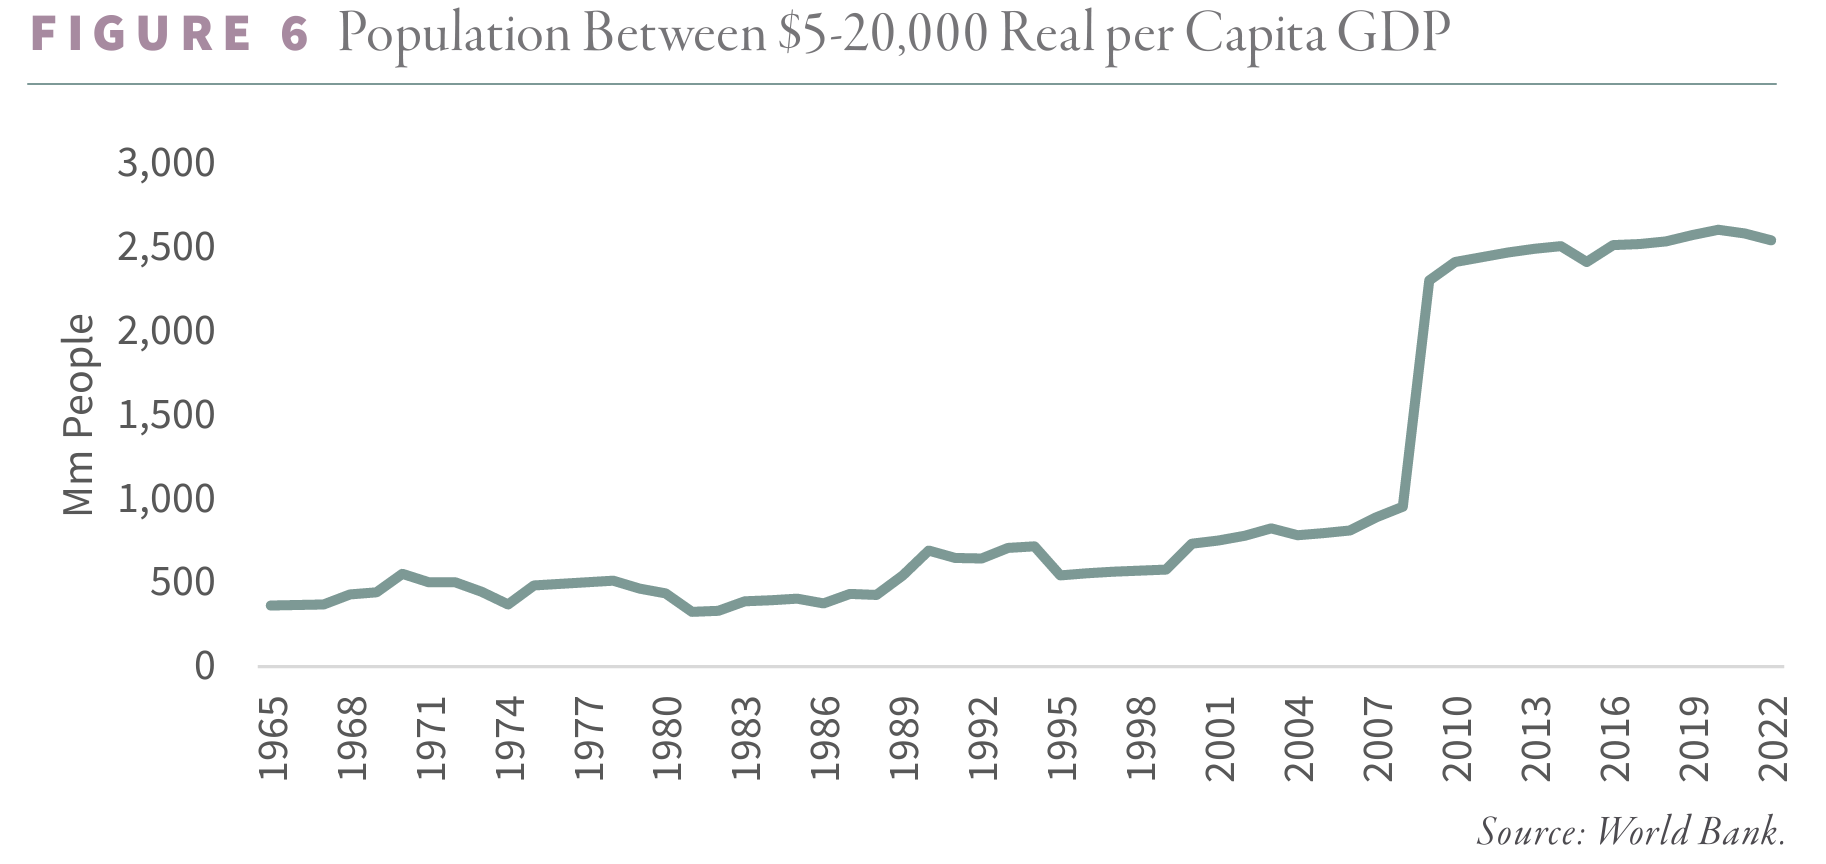
A THIRD OF THE WORLD’S POPULATION IS NOW IN THE “SWEET SPOT” OF ENERGY DEMAND GROWTH, REPRESENTING HALF OF ALL ECONOMIC GROWTH. NEVER BEFORE HAVE SO MANY PEOPLE SIMULTANEOUSLY BEEN IN A PERIOD OF ENERGY-INTENSIVE ECONOMIC GROWTH. SO LONG AS THIS IS TRUE, GLOBAL ENERGY DEMAND WILL REMAIN A TAILWIND.
Therefore, countries between $5,000 and $20,000 per capita real GDP are the most significant when studying growth trends. While an economy’s real per capita GDP is less than $5,000, energy consumption is inconsequential; consumption begins to flatten when it is above $20,000. For most of the twentieth century, people between $5 and $20,000 per capita GDP remained relatively constant at 500 mm. While new countries would enter the bloc (such as Brazil in 1975), others would leave (such as Japan in 1981). Between 2000 and 2010, the population of energy-hungry consumers surged from 600 mm to 2.4 bn, and by 2022, the number had reached 2.6 bn. A third of the world’s population is now in the “sweet spot” of energy demand growth, representing half of all economic growth. Never before have so many people simultaneously been in a period of energy-intensive economic growth. So long as this is true, global energy demand will remain a tailwind.
Using the IEA’s methodology, between now and 2040, global energy demand is projected to fall by 3%, with real GDP per capita growing by 40%, demand per GDP (somehow) falling by 40%, and population growing by 15%. Using our S-Curve, energy demand will increase by 35%, assuming the same real GDP and population growth rate. Poor countries will go from $6 to $9,000 per capita GDP, causing energy demand to surge 43% per capita. With 16% population growth, emerging market energy demand should rise nearly 70%.
 Even if developed countries’ energy per capita fell by 20% (something we believe impossible), global energy demand would still increase by more than a third.
While the IEA assumes global energy demand will peak around now, our model predicts it will grow by 217 EJ between now and 2040, representing the fastest seventeen-year period of growth in human history.
Nor are we concerned about a recession over the near term. First, our real-time models confirm demand remains robust. Even if a severe coordinated slowdown took hold, we believe the impacts would be less painful and shorter-lived than most analysts expect. There have been four global recessions since 1965: 1975, 1982, 1991, and the Global Financial Crisis (GFC) in 2009. In the first three instances, global energy demand fell by 1%, driving average per capita energy demand lower by 4.4%. Energy per capita took eight years on average to recover to pre-recession highs. The GFC was much worse in terms of economic dislocation. Global per capita GDP fell by 2.5% -- nearly three times the average of the previous three worldwide recessions. However, because of the rising influence of energy hungry emerging market economies, per capita energy demand only fell by 2.9% -- one third less than in the previous three recessions despite a nearly three times sharper slowdown in economic activity. Instead of taking eight years, per capita energy demand surpassed the pre-crisis high by 2010. If we experience another global slowdown (of which we have no evidence presently), the impact would be much less than people expect.
We want to leave you with our corollary to the Jevons Paradox: only high energy prices reduce demand. The IEA paints a bearish picture in which improved efficiency reduces aggregate demand and persistent low energy prices. We would offer a different take: economic output and, by extension, energy demand will surprise to the upside until high energy costs reduce overall activity. In such a world, what assets would you prefer to own?
Intrigued? We invite you to download or revisit our entire Q3 2023 research letter, available below.

Registration with the SEC should not be construed as an endorsement or an indicator of investment skill, acumen or experience. Investments in securities are not insured, protected or guaranteed and may result in loss of income and/or principal. Historical performance is not indicative of any specific investment or future results. Investment process, strategies, philosophies, portfolio composition and allocations, security selection criteria and other parameters are current as of the date indicated and are subject to change without prior notice. This communication is distributed for informational purposes, and it is not to be construed as an offer, solicitation, recommendation, or endorsement of any particular security, products, or services. Nothing in this communication is intended to be or should be construed as individualized investment advice. All content is of a general nature and solely for educational, informational and illustrative purposes. This communication may include opinions and forward-looking statements. All statements other than statements of historical fact are opinions and/or forward-looking statements (including words such as “believe,” “estimate,” “anticipate,” “may,” “will,” “should,” and “expect”). Although we believe that the beliefs and expectations reflected in such forward-looking statements are reasonable, we can give no assurance that such beliefs and expectations will prove to be correct. Various factors could cause actual results or performance to differ materially from those discussed in such forward-looking statements. All expressions of opinion are subject to change. You are cautioned not to place undue reliance on these forward-looking statements. Any dated information is published as of its date only. Dated and forward-looking statements speak only as of the date on which they are made. We undertake no obligation to update publicly or revise any dated or forward-looking statements. Any references to outside data, opinions or content are listed for informational purposes only and have not been independently verified for accuracy by the Adviser. Third-party views, opinions or forecasts do not necessarily reflect those of the Adviser or its employees. Unless stated otherwise, any mention of specific securities or investments is for illustrative purposes only. Adviser’s clients may or may not hold the securities discussed in their portfolios. Adviser makes no representations that any of the securities discussed have been or will be profitable. Indices are not available for direct investment. Their performance does not reflect the expenses associated with the management of an actual portfolio.