“The physical commodity markets and the natural resource equity markets are telling two drastically different stories.”
At Goehring & Rozencwajg, we are deep-value, contrarian investors. For nearly 30 years, we have been studying long, drawn-out bear markets. One of our observations over the years has been that distinct anomalies develop at or near the bottom of these protracted periods of investor negativity. As investors become increasingly panicked, reason often gives way to strong emotional responses. As value investors, we are inclined to doubt the efficient-market hypothesis.
However, we do agree that the broad market serves as an aggregate measure of investor expectations. Therefore, whether the market is right or wrong, you would expect its views to be internally consistent. While this is true most of the time, there are distinct periods where emotion takes over entirely, and Mr. Market appears to offer contradictory advice. We believe these periods are often associated with major market turning points and so we study them intensely. Today we would like to touch on one major anomaly currently underway that we hope is a sign we’re nearing a capitulation bottom in the commodity markets.
The largest anomaly we see today is the price action between commodities and commodity stocks.
We were quoted in Barron’s on June 28th, 2019. The article discussed how the first half of 2019 was the strongest start for commodity prices in 11 years. The Goldman Sachs Commodity Index advanced by 13% over the first six months of the year to end at 2,497, the highest first-half advance since 2008. Since the bottom in February 2016, the index has advanced by 32%. Focusing on oil, WTI advanced by 30% during the first six months of the year, making it the second highest reading in 11 years. Oil prices are now 125% above their February 2016 lows.
An energy equity investor, however, experienced something very different. For the first six months of the year, the S&P Oil & Gas Exploration and Production Index was up only 3%, the sixth worst start to the year in the past two decades. Since oil bottomed in February 2016, this same group is up less than 5%, lagging the commodity price by 120 percentage points. While larger capitalization energy stocks did better since the market bottomed in 2016, even the market-cap weighted natural resource stock index only returned 21% over the same period. The discrepancy in the oil service stocks has been even more stark. For example, since the oil market bottomed in February 2016, the OSX is down 41% despite the doubling of the oil price. So far this year, it is down 3% despite the best start for the commodity markets in over a decade.
Crude Oil Prices versus Oil Service Sector (OSX)
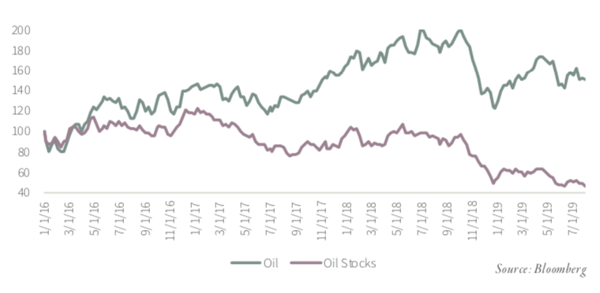
The physical commodity markets and the natural resource equity markets are telling two drastically different stories. The physical markets are telling you that chronic tightness has emerged in several commodities, while the equity market is telling you the whole sector is nearing distress. Notably, this alleged distress is not being reflected at all in natural resource-related bond prices, often a good indicator of potential trouble. We believe this divergence is incredibly important. Rarely do the commodity markets and natural resource equity markets differ so materially. This divergence should not be ignored.
This blog contains excerpts of our in-depth commentary, "The Gold Bull Market is Here". If you are interested in this subject, we encourage you to download the full commentary here.