
The article below is an excerpt from our Q2 2023 commentary.
Gold is no different than any other asset class: it becomes popular, rises in price, is overvalued, and ultimately represents a poor investment. Other times, it undergoes periods of investor disinterest, suffers sustained price declines, becomes undervalued, and ultimately represents an excellent investment.
We are not gold bugs. Over the long term, gold protects monetary debasement; however, unlike equities, gold will provide little real return. If an investor can identify periods when gold becomes extremely undervalued, it can offer exceptional excess returns, often uncorrelated with other financial assets.
The key is figuring out when gold is undervalued and overvalued.
In this essay, we will describe the various valuation frameworks we have used over many years to estimate gold price targets and determine when to add or reduce our gold exposure.
In May 2000, I was profiled in Forbes (link) and discussed gold’s radical undervaluation. I predicted gold would reach $2,500 per ounce before the bull market ended. When the article was published, gold was $275 per ounce, and continuous central bank selling had left investors wildly bearish towards the so-called “barbarous relic.” Our valuation framework pointed instead to substantial potential returns. Although gold never hit our $2,500 target, it reached $1,900 in 2011 and was the best-performing asset class of the 2000s.
Gold has been in a bull market for nearly a generation, leaving many questioning if it still represents an attractive investment as in the late 1960s or 1990s.
After bottoming at $251 per ounce in August 1999, gold surged to $1,900 in August 2011, pulled back to $1,050 by December 2015, and resumed its advance, making an all-time high triple-tops of $2,050 in August 2020, March 2022, and May 2023. However, gold is now as undervalued as in 1999 on several metrics.
Potential gold investors must ask three questions.
First, is gold undervalued today?
Second, if gold is undervalued, to what degree?
And finally, how high could it go were it to swing from undervalued to overvalued – something that has happened twice in 100 years?
To help answer the first question, we compare the value of gold to both the money supply and the value of financial assets. We also find it helpful to consider the historical relationship between gold and other commodities.
Below are three charts that highlight these relationships over the last 100 years. The first chart shows the relationship between the size of the US Treasury’s gold holdings and the Federal Reserve’s balance sheet.
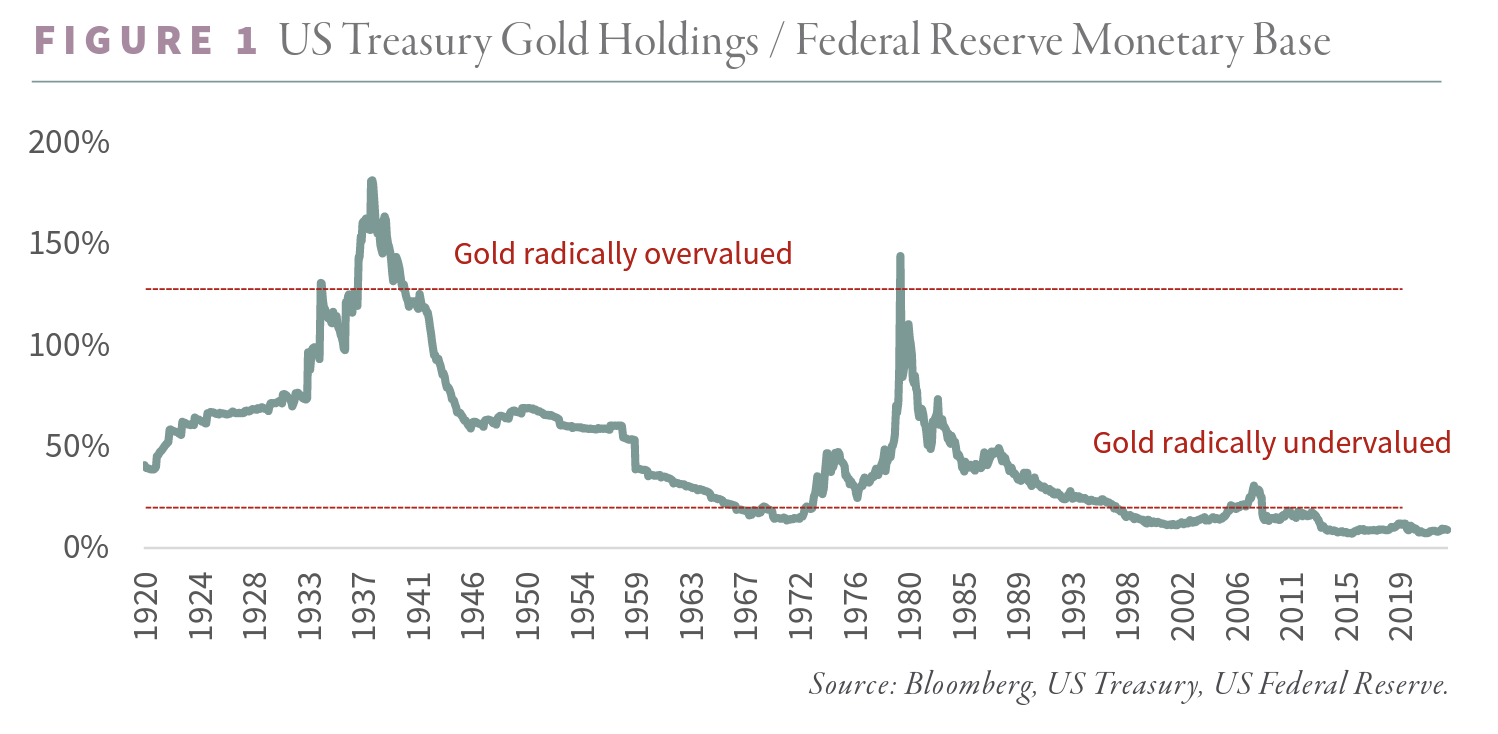
Although somewhat controversial, we believe the size of the Fed’s balance is related to the dollar value of the Treasury’s gold holdings over the long term. According to this chart, there have been two distinct periods over the past 100 years during which gold was highly overvalued and three periods during which gold was significantly undervalued. In the late 1930s, President Roosevelt devalued the dollar by 65%, raising the gold price to $35 per ounce. At the same time, clouds of war were gathering across Europe. The combination of a higher gold price in the US and growing hostilities in Europe led to a massive volume of gold inflows in America. At the peak, the dollar value of the Treasury’s gold holdings exceeded the size of the Fed’s balance sheet by an incredible 1.7 times. The gold flows into the US were so great that the Treasury could have exchanged every dollar bill in circulation for gold and retained half of its gold stock.
The gold’s second period of overvaluation occurred in January 1980. Gold spiked in a parabolic blow-off to $850 per ounce in January 1980, following two decades of accelerating inflation. At the peak, the Treasury’s gold holdings (vastly diminished from the late-1930s levels) were once again valued at 1.7 times the size of the Federal Reserve balance sheet.
Gold turned out to be a terrible investment after both periods of radical overvaluation. Between 1937 and 1971, gold was flat while the stock market advanced tenfold. Between 1980 and 2000, gold fell 70% while the stock market ran thirteen-fold.
On the other hand, gold was radically undervalued three times. The first period occurred in the late 1960s. With gold fixed at $35 under the Bretton Wood’s Gold Exchange Standard and inflationary pressures mounting in the US, gold flowed out of the Treasury. By 1971, the Fed’s monetary base exceeded the Treasury’s gold holdings by seven times. The three-decade reversal was impressive: between 1938 and 1971, the Treasury’s gold holdings went from covering the Fed’s monetary base by 1.7 times to less than 15%.
The second period of undervaluation occurred during the late 1990s. Following twenty years of falling gold prices and a rapid expansion of the Fed’s balance sheet, the size of the Fed’s monetary base exceeded the Treasury’s gold holdings by nine times. In other words, the dollar’s unofficial (and unconvertible) gold coverage reached an all-time low of 11%.
As we saw, the periods of overvaluation (the 1930s and 1980) were great opportunities to sell gold. Conversely, the periods of undervaluation (1969 and 1999) were excellent buying opportunities. Gold was the best-performing asset class in the decade following each period of maximum undervaluation.
Gold, relative to the size of the Fed’s balance sheet, is more undervalued today than in the late 1960s or 1990s. The reason: even though gold advanced over seven-fold over the last twenty-three years, the Federal Reserve’s balance sheet has grown even faster. Following the global financial crisis of 2008, global central banks have undertaken radical monetary policies.
Since 2008, the Federal Reserve has undertaken four massive rounds of quantitative easing, resulting in a monetary base nine times larger than in 1999. The Fed printed money faster than gold appreciated over the last twenty-three years. The Fed’s monetary base currently stands at over nine times the Treasury’s gold holdings, compared with six times in 1969 and nine times in 1999 – the other two excellent buying opportunities. According to our analysis, gold is 30% more undervalued than in 1969 and on par with 1999.
Valuing gold against financial assets tells a similar story. Chart 2 shows the relationship between gold and the Dow Jones Industrial Average. Over the last 100 years, there have been three periods during which gold was radically undervalued relative to financial assets.
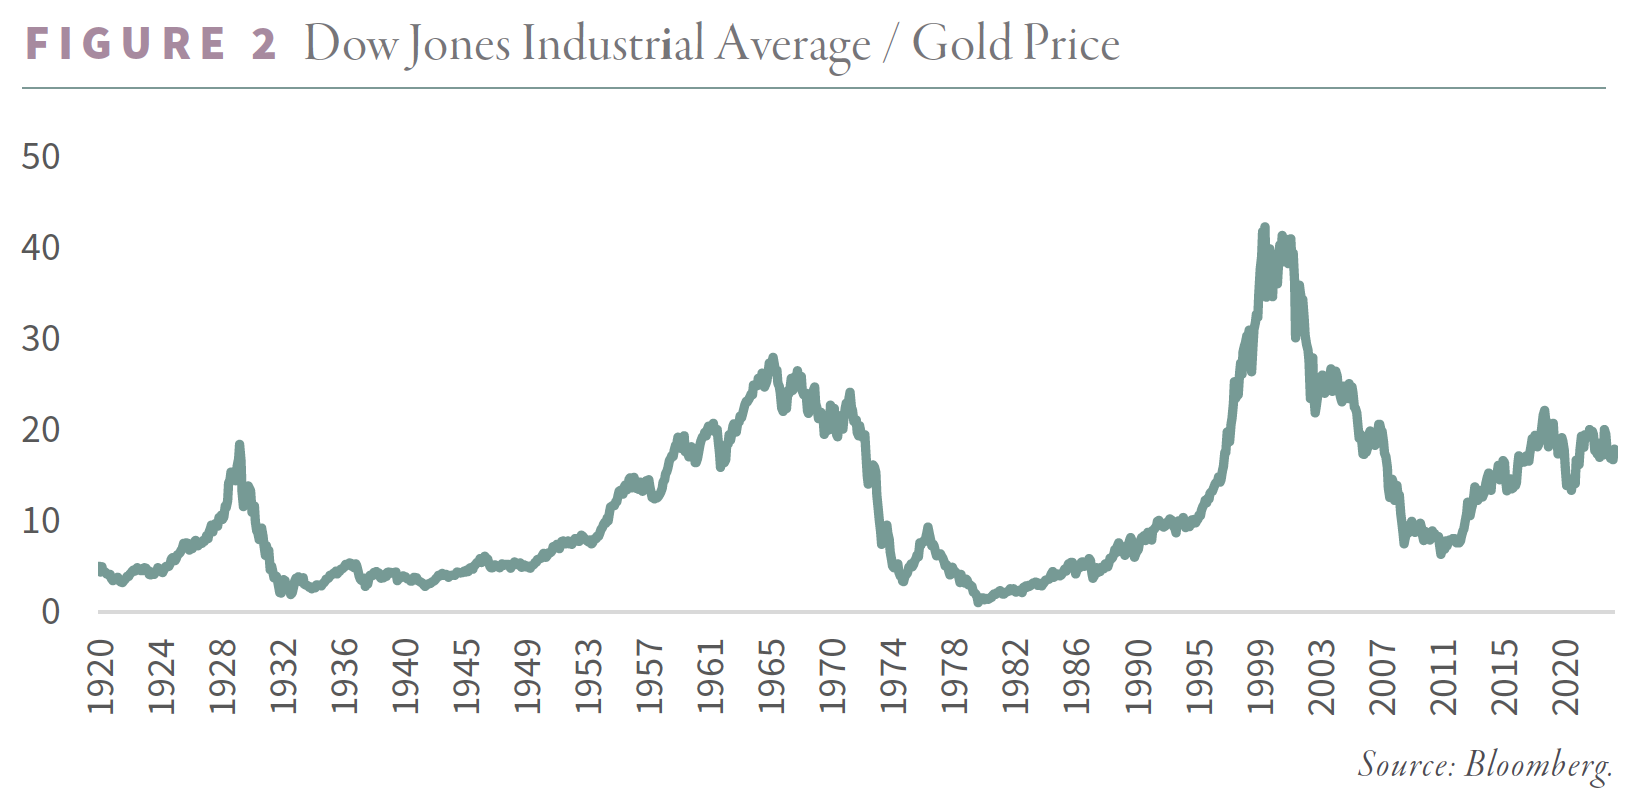
The first period occurred in the late 1920s. In response to a decade of rapid monetary growth in the US (related to Britain’s failed attempt to peg the pound to gold at the pre-World War I rate), the US stock market surged, driven mainly by speculation funded by borrowed money. From the 1921 lows, the Dow appreciated six-fold, hitting 380 in August 1929.
With gold fixed at $20.65 per ounce, the Dow, by the fall of 1929, was equivalent to approximately eighteen ounces. In retrospect, the stock market was radically overvalued. Over the next four years, the Dow fell 90%, bottoming at 42. At the lows, the Dow was equivalent to only two ounces of gold – an extreme reading that would not be repeated for fifty years.
In January 1934, Roosevelt raised the gold price to $35 per ounce. The Dow and gold nearly reached parity in 1932; however, they missed each other by $7 per ounce and eighteen months. Between 1929 and 1934, the Dow fell 80% while gold rose 70%. From 1929 to 1935 gold radically outperformed global equity markets.
The next time financial assets were radically overvalued relative to gold occurred in the late 1960s. The Dow first broke 1,000 in 1966 and then again in 1969 and 1971. With gold still fixed at $35 per ounce, the Dow was equivalent to twenty-eight ounces– a new record. The 1960s experienced long periods of excess money and credit creation, resulting in a speculative bull market again funded by debt. In retrospect, financial assets were overvalued. Between the late 1960s and 1980, the Dow fell by 25% while gold advanced twenty-four-fold. Finally, by 1980, the Dow and gold both hit 850.
Gold entered a grinding bear market following its record overvaluation in 1980. On the other hand, financial assets spent the next two decades rallying. Following the 1929 episode, gold took fifty years to work off its overvaluation. Following the 1980 peak, gold only took twenty years to become cheap relative to financial assets. Between 1980 and 1999, gold fell by 68% from $850 to $253 per ounce, while the Dow advanced thirteen-fold from 850 to 11,000. A prudent investor ought to have been out of the gold market entirely.
In 1999 the Dow surpassed 11,000 while gold had fallen to $253 per ounce. The Dow was equivalent to forty-three ounces of gold at those levels – an all-time record. Given these extreme levels, an investor ought to have expected a booming bull market in gold to develop. Indeed, that is what I expected when I made my investments and gave my interview to Forbes in 2000.
We were handsomely rewarded. Between 1999 and 2011, gold surged seven-fold, becoming the best-performing asset class of the decade. Global equities suffered two massive bear markets, ending the period where it started.
Over the last decade, the stock market has again entered another huge bull market, leaving the Dow equivalent to 20 ounces of gold. The question is whether this represents under- or overvaluation. Financial bulls (i.e., gold bears) might highlight how the Dow has been equivalent to thirty ounces of gold in the late 1960s and forty ounces in the late 1990s. In this context, 20:1 does not appear radically undervalued. Perhaps the equity bull market will continue. Unfortunately, for equity markets, we firmly believe otherwise.
Chart 3 gives us great confidence that today’s 20:1 ratio will end up being the cycle peak and that over the next several years, the Dow will be equivalent to fewer than five ounces of gold, the level reached at gold's peak in 2011. The Dow and gold may again cross, similar to what happened in 1980 and almost happened in 1932-4.
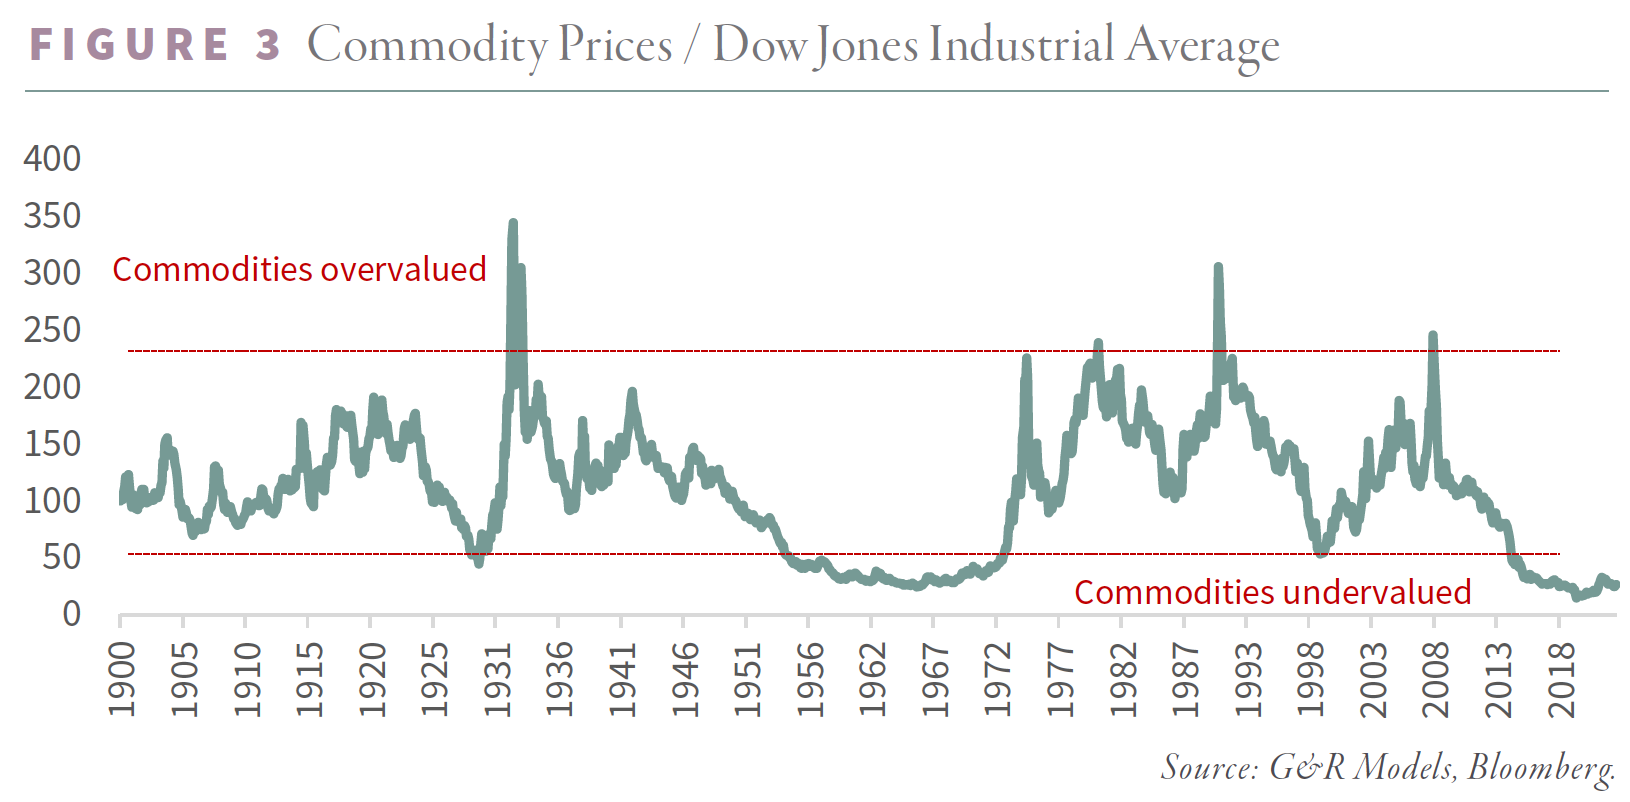
Each peak in the Dow-gold ratio (1929, 1969, and 1999) coincided with periods of commodity undervaluation. As each commodity bull market started, the Dow-gold ratio contracted massively. In 1929, commodities bottomed relative to financial assets exactly as the Dow reached a high of twenty ounces of gold equivalent. Four short years later, commodities were overvalued relative to financial assets, and the Dow was equivalent to only two ounces of gold after having rallied 70%.
In 1968 (the year President Johnson removed the US dollar’s required 25% gold backing), commodities were the cheapest in history relative to financial assets. At that moment, the Dow peaked at twenty-eight ounces of gold. Over the next twelve years, commodities entered a massive bull market and, by 1980, had become radically overvalued. Gold led the bull market and soared twenty-four-fold from $35 to $800 per ounce. Like in 1929, the Dow-gold ratio peaked in 1968 at precisely the same time commodities bottomed. By January 1980, the Dow was equivalent to one ounce of gold – the lowest reading since the Dow Jones Industrial Average was established in 1896.
In 1999, commodities were almost as radically undervalued as in the late 1960s. The Dow-gold ratio reached an all-time high of forty-two just as commodities bottomed. As commodity prices rose, the Dow-gold ratio contracted, reaching eight in 2011.
Were commodities overvalued today, we would agree that the boom in financial assets (and bear market in gold) still had years left to run. Under these circumstances, the Dow-gold ratio would continue to move significantly higher. Instead, commodities are as undervalued as they have ever been relative to financial assets. According to our historical framework, a commodity bull market has likely started. As such, we believe the Dow, equivalent to twenty ounces of gold, probably represents a cycle-high and will fall throughout the decade, similar to 1929, 1969, and 1999.
How high could prices go if we enter a new gold bull market?
In past gold bull markets, the value of the Treasury’s gold holdings has surpassed the monetary base by over 1.5 times – including in 1980 after the US dollar was no longer backed by gold.
Given the Fed’s balance sheet explosion since 2009, a projected target price for gold seems outlandish. The Fed’s monetary base today stands at $5.6 tr. For the Treasury’s gold holdings to cover the monetary base by 1.5 times, gold would have to reach $32,000 per ounce. Critics might argue the monetary base is distorted by excess reserves left on balance at the Fed. At present, excess reserves foot to $3.2 tr, and the Fed has talked of someday draining them out of the system. If that were to happen, the Fed’s monetary base would fall to $2.4 trillion. Even under this conservative scenario, gold would have to reach $14,000 for the Treasury’s gold position to cover the monetary base by 1.5 times. Although these numbers sound outlandish, they represent relationships that have emerged twice in the past 100 years. The first time (the late 1930s) was during massive deflation, while the second (1970) was during inflation. In both scenarios, gold had become the “must own” asset class that all investors clamored for, and the valuation of gold was pushed to the extreme.
Could the dollar value of the Treasury’s gold holdings reach 1.5 times the monetary base-- as it has twice in the last 100 years? We believe it’s highly probable. As financial turmoil surges this decade, investors will aggressively buy gold as an asset class that provides both wealth protection and the opportunity for huge speculative profit. In such a scenario, gold’s valuation could very well be pushed to extremes just like it was in the late 1930s and 1980.
What about looking at the Dow-Gold relationship?
In the 1930s, the Fed aggressively shrunk its balance sheet by half, producing a deflation implosion that turned into the Great Depression. At the worst point in the crisis, the Dow traded at half its $80 book value. By 1934, gold (now at $35 per ounce) nearly reached parity with the Dow. Currently, the Dow’s book value is 8,000. Were the Fed to undertake equally draconian hawkish measures as in the 1930s (something we believe to be unlikely), the Dow could conceivably trade for half its book value, or 4,000. Were gold to trade at parity to the Dow, like it nearly did in 1934, it would more than double. In other words, in the most extreme deflationary scenario, the Dow would fall almost 90% while gold would double – similar to between 1929 and 1934. Investors, with a substantial gold allocation, would do very well.
In the late 1970s, the Fed ultimately raised interest rates to record levels in a final successful attempt to break the inflationary forces of the past twenty years. Record real rates put severe downward pressure on global equities. By 1980, the Dow traded at its book value of 850. Gold reached parity with the Dow in January 1980.
If we repeat the 1970s and the Fed raised interest rates significantly because of persistent acceleration in inflation, we should see a huge bear market in the Dow with a downside target of its 8000 book value. If history were to repeat the 1970s experience, the Dow to enter a huge bear market and potentially trade down 75% to its book value, and gold prices would rise four–fold Again, investors with significant gold allocations would be the winners.
Finally, let us consider a third scenario that has never occurred in 230 years of US financial history. What might happen if the US directly monetized its debt?
Given the massive amount of sovereign debt held by governments worldwide and the inherent refinancing risks that it creates, countries (including the US) may attempt to directly monetize their debt in response to a potential failure of a government debt auction. Were this to happen, inflationary pressures would surge, and hyperinflation may ensue. Our hunch is that equities markets may rise, but gold would enter a massive bull market as investors sought assets to protect against currency debasement and the resulting inflation. In such a scenario, gold could easily surpass $35,000 per ounce – 1.5 times today’s $5.6 tr monetary base. Once again, the winners would be gold investors.
In our view, gold will emerge as the asset class with the most potential this decade, no matter the financial or geopolitical backdrop. Under the most extreme scenarios (a repeat of the deflationary implosion that produced the Great Depression or a period of inflation that verges on hyperinflation), gold will be the winning asset class.
Intrigued? We invite you to download or revisit our entire Q2 2023 research letter, available below.

Registration with the SEC should not be construed as an endorsement or an indicator of investment skill, acumen or experience. Investments in securities are not insured, protected or guaranteed and may result in loss of income and/or principal. Historical performance is not indicative of any specific investment or future results. Investment process, strategies, philosophies, portfolio composition and allocations, security selection criteria and other parameters are current as of the date indicated and are subject to change without prior notice. This communication is distributed for informational purposes, and it is not to be construed as an offer, solicitation, recommendation, or endorsement of any particular security, products, or services. Nothing in this communication is intended to be or should be construed as individualized investment advice. All content is of a general nature and solely for educational, informational and illustrative purposes. This communication may include opinions and forward-looking statements. All statements other than statements of historical fact are opinions and/or forward-looking statements (including words such as “believe,” “estimate,” “anticipate,” “may,” “will,” “should,” and “expect”). Although we believe that the beliefs and expectations reflected in such forward-looking statements are reasonable, we can give no assurance that such beliefs and expectations will prove to be correct. Various factors could cause actual results or performance to differ materially from those discussed in such forward-looking statements. All expressions of opinion are subject to change. You are cautioned not to place undue reliance on these forward-looking statements. Any dated information is published as of its date only. Dated and forward-looking statements speak only as of the date on which they are made. We undertake no obligation to update publicly or revise any dated or forward-looking statements. Any references to outside data, opinions or content are listed for informational purposes only and have not been independently verified for accuracy by the Adviser. Third-party views, opinions or forecasts do not necessarily reflect those of the Adviser or its employees. Unless stated otherwise, any mention of specific securities or investments is for illustrative purposes only. Adviser’s clients may or may not hold the securities discussed in their portfolios. Adviser makes no representations that any of the securities discussed have been or will be profitable. Indices are not available for direct investment. Their performance does not reflect the expenses associated with the management of an actual portfolio.