
The article below is an excerpt from our Q3 2023 commentary.
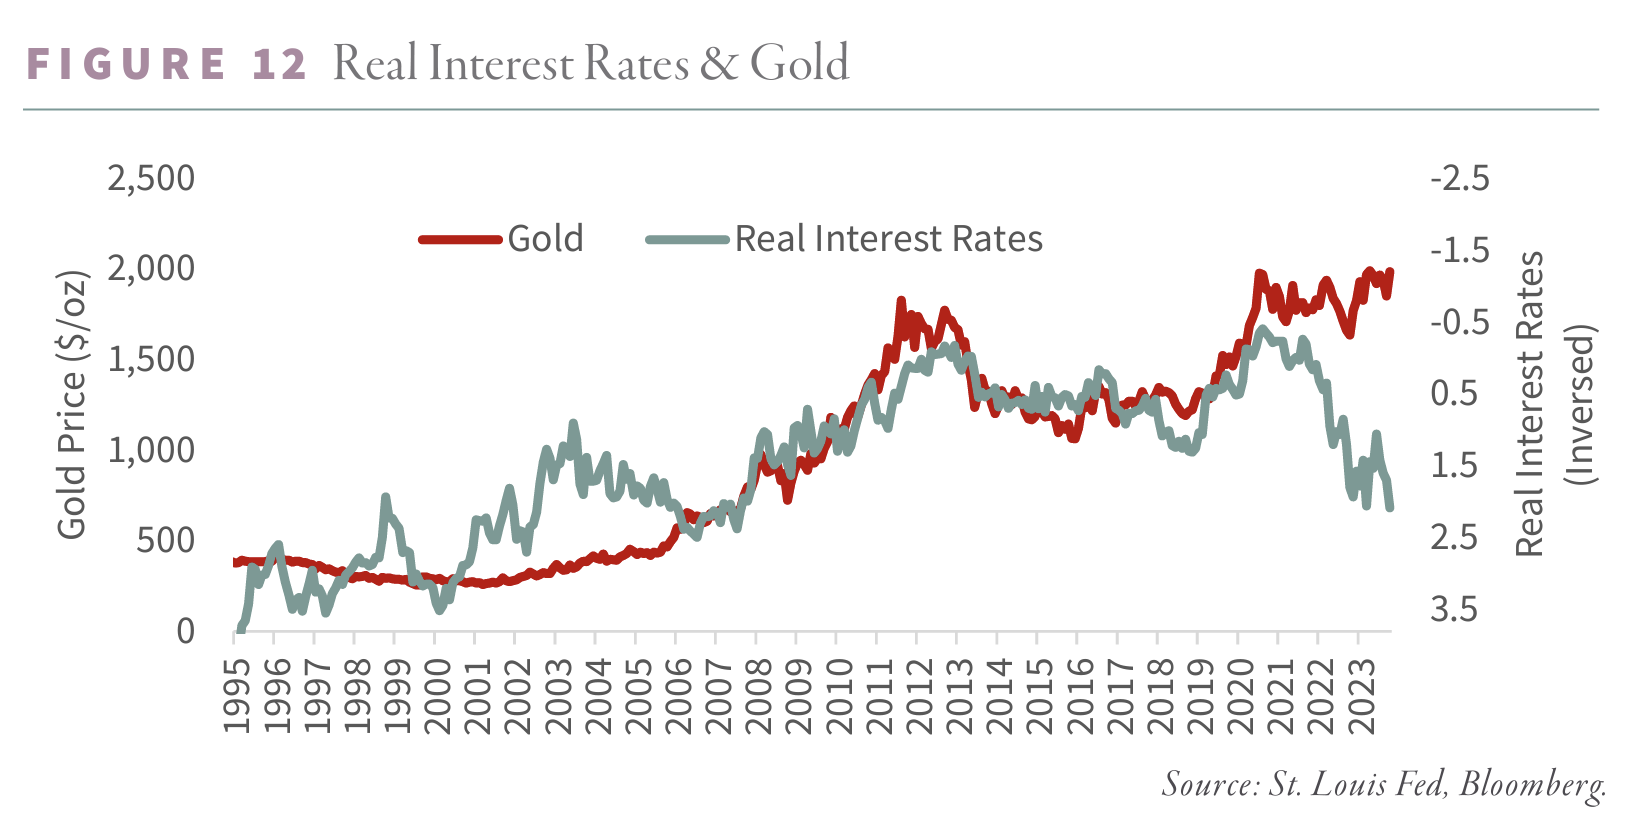
Real interest rates and gold have always moved in opposite directions. When real interest rates rise, gold falls, and when real rates fall, gold rises.
Over the last three years, this relationship broke down. Real interest rates bottomed at -2.3% in the summer of 2021 and surged to +2.9% by late 2023 – the highest rate in twenty-five years. Given the record surge in real rates, gold should have suffered a punishing bear market. Instead, gold is only 2% below its 2020 peak despite a 400 bps rise in real rates.
What does this divergence signal?
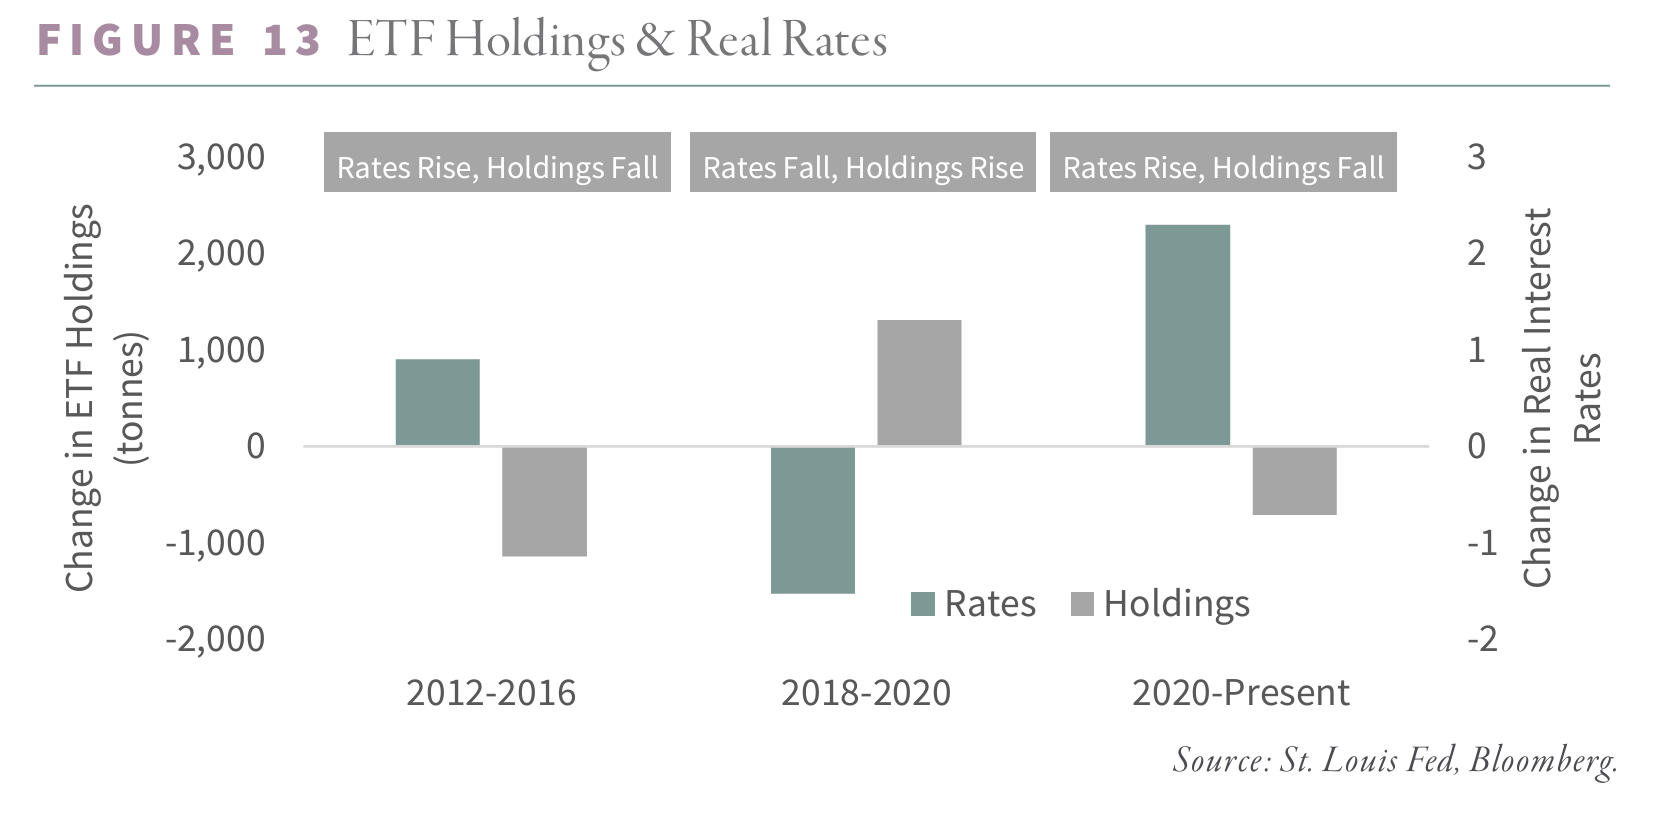
Western investors are behaving as they have in the past rising real rate cycles: they are selling gold. We track eighteen physical gold ETFs, and the relationship between real rates and gold accumulation is clear. The last time real interest rates rose was between 2012 and 2016, during which period Western investors liquidated over 1,000 tonnes from the physical ETFs, causing gold to fall 45%. Since the summer of 2020, real rates have again surged, and Western investors have predictably shed 760 tonnes of gold. Somehow, gold remains near its all-time high.
The difference is central banks. Over the last several years, central banks have gone on a massive gold-buying spree. Last year, central banks accumulated 1,136 tonnes – a record as far back as our dataset goes. This year, they have continued to accumulate. For the first nine months of 2023, the World Gold Council (WGC) reports central banks purchased an additional 800 tonnes of gold, with 337 tonnes coming in the third quarter alone. Year-to-date, central bank gold purchases are up 14% compared to last year. China remained the most significant gold buyer, purchasing 78 tonnes in the third quarter. For the first nine months of 2023, the PBOC bought a massive 181 tonnes.
We believe strong central bank buying will continue. We commented on the relationship between radical commodity price under-valuations and monetary regime changes in past letters. Please refer to our 1Q23 essay, “The US Reserve Currency & Commodities,” for an in-depth discussion. The last three periods of radical commodity undervaluation (late 1920s, late 1960s, and late 1990s) saw a significant change in the global monetary regime.
In 1930, Britain left the classical gold standard, which had been in place for almost 200 years. The shock caused the US to devalue the dollar by 60% in 1933 and later default by eliminating the gold convertibility clause embedded in all Treasury debt. In 1968, President Johnson removed the requirement that gold back 25% of each US dollar. By 1971, President Nixon closed the US gold window and ended the Bretton Wood’s gold exchange regime entirely. The era of exchanging currencies into gold was over, and commodity prices spent the next decade soaring.
The 1997 Asian currency crisis ended the pegging of major Asian currencies to the US dollar. After their currencies collapsed, these countries (most conspicuously China) suppressed their exchange rates, turning current account deficits into substantial current account surpluses, ultimately leading to the great housing price bubble and the Global Financial Crisis.
Although few historians have documented the relationship between commodity bear markets and monetary regime shifts, we believe low commodity prices ultimately lead to changes in the global monetary order.
The 1920s experienced a considerable commodity bear market—prices from 1920 to 1930 fell by 70%. The result was a decade of deflation, particularly in agricultural commodities.
The lack of inflationary pressure allowed the Federal Reserve to experiment with the first attempts at what today we would call quantitative easing. First, in 1924 and again in 1927, the Fed lowered rates despite strong domestic economic growth to help support Britain’s attempt to go back on gold at the pre-World War I rate.
Excessive US monetary growth destabilized the financial system, resulting in the 1929 stock market crash, a global banking crisis, and, ultimately, the Great Depression.
Throughout the 1960s, commodities (especially oil) drifted lower, again becoming radically undervalued. Like in the 1920s, the lack of inflation allowed the US to run simultaneous monetary and fiscal expansions to fund the Vietnam War and President Johnson’s “Great Society” program. Expansionary monetary and fiscal policies again produced massive distortions. US dollar holdings by foreign countries soared, and equity markets exploded in a prolonged period of significant speculation. The result was the collapse of the Bretton Woods Gold Exchange Standard, once the US could no longer honor its commitment to exchange US dollars gold at the $35 per ounce rate.
Finally, in the 1990s, a severe commodity bear market allowed the US to put the “Greenspan Put” in place. The Federal Reserve could meet every consecutive financial crisis with low-interest rates and money printing, with minimal inflationary impact. Loose monetary policy again resulted in massive financial speculation, the eventual collapse of the Long-Term Capital Management hedge fund, the Asian currency crisis, Russia’s default, and, ultimately, the dot-com bubble’s collapse.
Our research tells us the necessary conditions for a monetary regime change are back in place. The huge bear market in the commodities last decade allowed the Fed to experiment with three periods of quantitative easing, resulting in an unprecedented six-fold increase in its balance sheet, with minimal inflationary pressure.
However, with global tensions now straining a financial system already severely distorted by zero interest rates and the return of persistent inflation, we believe a monetary regime change is imminent.
The big question is what will emerge to replace today’s fiat floating-exchange rate US dollar reserve currency system.
We believe a new monetary system will emerge in which countries can trade bilaterally in currencies other than the US dollar, settling their current account imbalances using gold.
Brazil has already agreed to settle its Chinese soybean and iron sales in renminbi, while Saudi Arabia is also considering settling its Chinese oil sales in renminbi. Total Energies has agreed to sell LNG to China, settled in renminbi.
China’s closed capital account makes it impossible to repatriate excess renminbi. However, if current account imbalances were settled by selling renminbi for gold at the Shanghai International Gold Exchange, then imbalances could be settled entirely outside China’s closed capital account.
China’s ultimate goal is to weaken the reserve currency status of the US dollar. Given its closed capital account, this goal is nearly impossible. However, if renminbi imbalances were settled in a liquid, easily convertible asset class, like gold, then China would be on its way to weakening the grip of the US dollar as a global reserve currency.
After decades of excessive monetary growth and globalization, trade imbalances now dwarf the size of the global gold market. If a new monetary system emerged in which gold was used to settle trade imbalances, central banks would have to continue accumulating gold, driving prices higher.
Although real interest rates continue to inch higher, and Westerners continue to sell gold, all this selling is being met by Central Bank purchasing. Once Western investors stop selling gold and begin accumulating, their buying will quickly bump up against Central Bank demand.
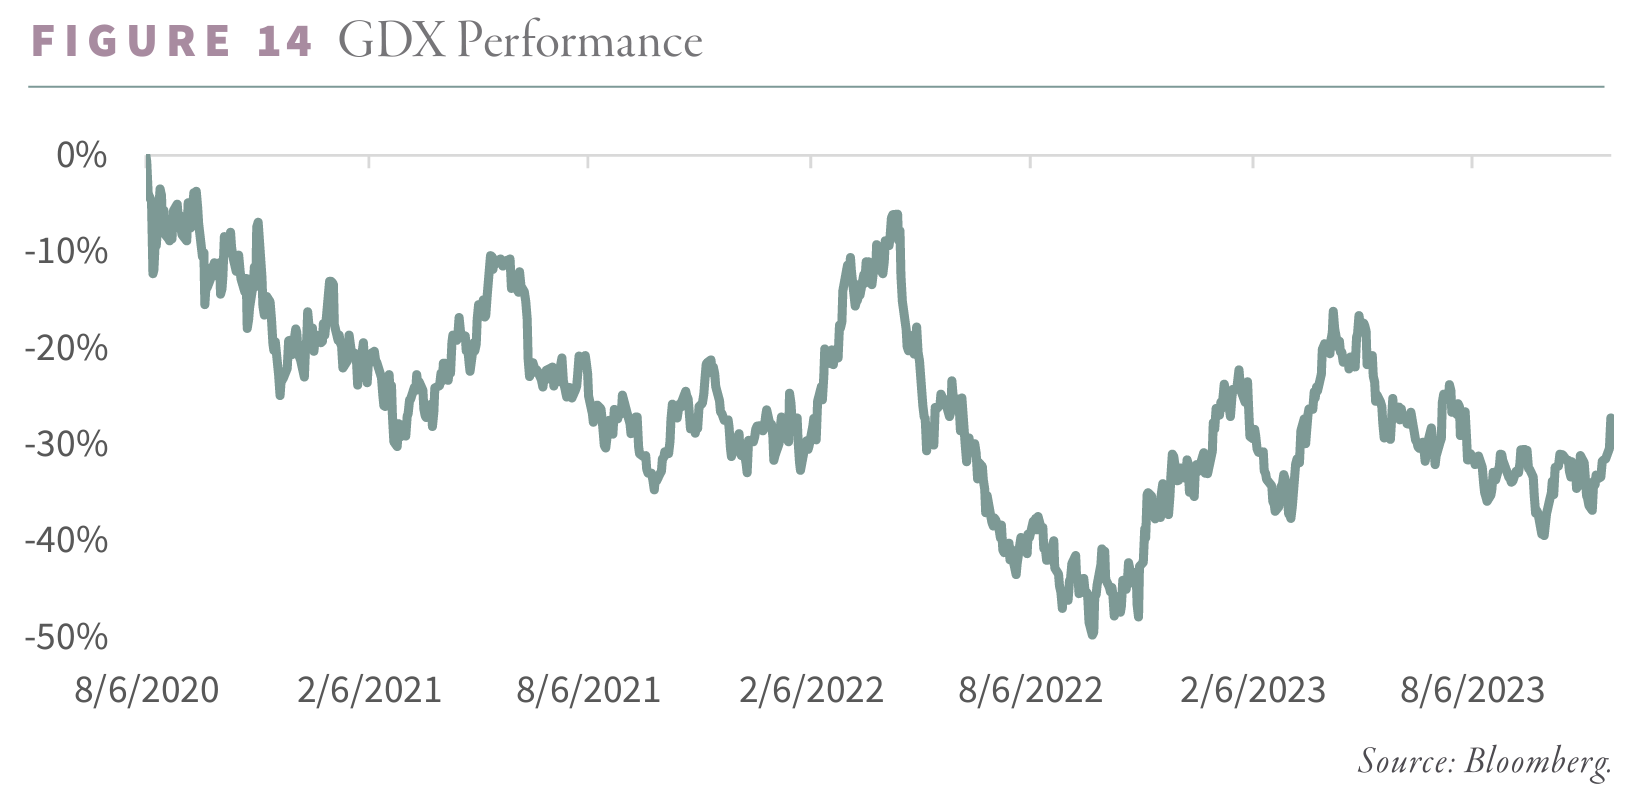
The next leg of the gold bull market is likely to begin at that moment. We are getting closer and closer, and we continue recommending investors maintain significant precious metals exposure. Physical gold has significantly outperformed precious metals equities, as Western investors have been selling both physical and equities.
Gold stocks (as measured by the GDX ETF) are down almost 30% from the 2020 peaks. Silver stocks, as measured by the SIL ETF, have pulled back even more—they have now pulled back 40%, and both represent excellent value.
Intrigued? We invite you to download or revisit our entire Q3 2023 research letter, available below.

Registration with the SEC should not be construed as an endorsement or an indicator of investment skill, acumen or experience. Investments in securities are not insured, protected or guaranteed and may result in loss of income and/or principal. Historical performance is not indicative of any specific investment or future results. Investment process, strategies, philosophies, portfolio composition and allocations, security selection criteria and other parameters are current as of the date indicated and are subject to change without prior notice. This communication is distributed for informational purposes, and it is not to be construed as an offer, solicitation, recommendation, or endorsement of any particular security, products, or services. Nothing in this communication is intended to be or should be construed as individualized investment advice. All content is of a general nature and solely for educational, informational and illustrative purposes. This communication may include opinions and forward-looking statements. All statements other than statements of historical fact are opinions and/or forward-looking statements (including words such as “believe,” “estimate,” “anticipate,” “may,” “will,” “should,” and “expect”). Although we believe that the beliefs and expectations reflected in such forward-looking statements are reasonable, we can give no assurance that such beliefs and expectations will prove to be correct. Various factors could cause actual results or performance to differ materially from those discussed in such forward-looking statements. All expressions of opinion are subject to change. You are cautioned not to place undue reliance on these forward-looking statements. Any dated information is published as of its date only. Dated and forward-looking statements speak only as of the date on which they are made. We undertake no obligation to update publicly or revise any dated or forward-looking statements. Any references to outside data, opinions or content are listed for informational purposes only and have not been independently verified for accuracy by the Adviser. Third-party views, opinions or forecasts do not necessarily reflect those of the Adviser or its employees. Unless stated otherwise, any mention of specific securities or investments is for illustrative purposes only. Adviser’s clients may or may not hold the securities discussed in their portfolios. Adviser makes no representations that any of the securities discussed have been or will be profitable. Indices are not available for direct investment. Their performance does not reflect the expenses associated with the management of an actual portfolio.