
The article below is an excerpt from our Q2 2024 commentary.
As we write, gold has surged past the $2,500 mark for the first time in history, an event that would seem to herald a golden age for gold stocks. Yet paradoxically, these stocks have seldom been cheaper. What underlies this dissonance, and what might it portend for the future?
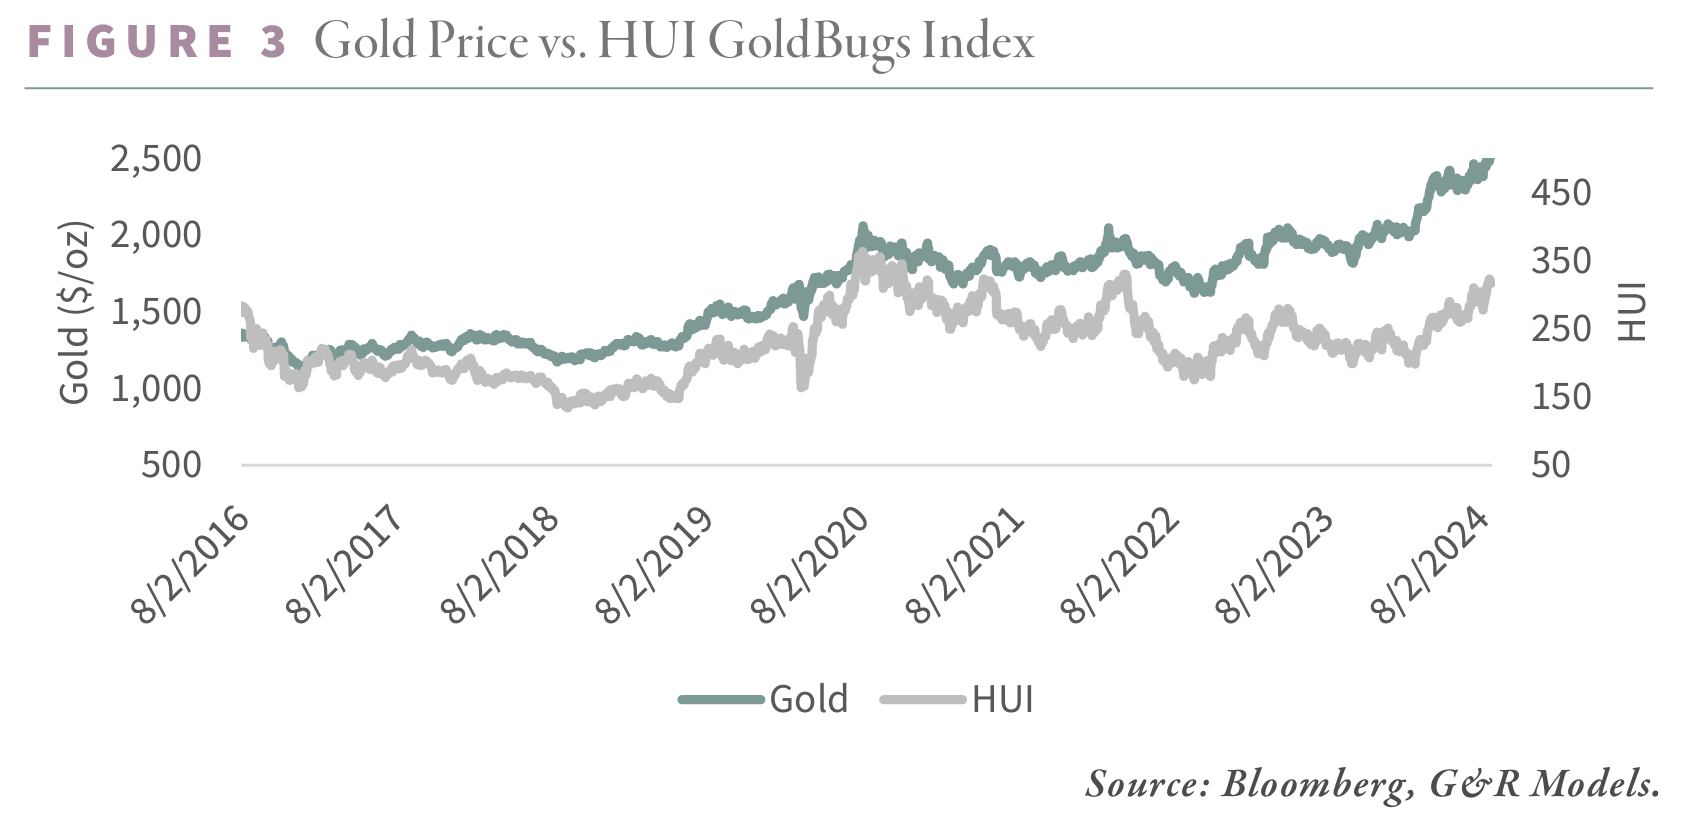
Before delving into these questions, it’s instructive to reflect on the historical backdrop. The last great bull market in gold spanned from 1999 to 2011, during which the price of gold soared from $252 to $1,900 per ounce, an eightfold increase. After a sharp correction between 2011 and 2015, gold resumed its upward trajectory, now trading 30% above its 2011 peak. Gold equities, however, have failed to follow suit. The NYSE Arca Gold Bugs Index (HUI), a benchmark for gold stocks, languishes at 312, more than 50% below its September 2011 high. Even more striking, the HUI today is only 10% above its August 2016 level—when gold was a mere $1,300 per ounce. Meanwhile, the HUI’s earnings per share are expected to quadruple this year compared to 2016.
This disconnect between gold and gold equities is largely explained by interest rates and the behavior of central banks. Since 2020, real U.S. 10-year interest rates have climbed from -0.40% to 2.1%. Western investors, habituated to offloading gold in response to rising real rates, have acted predictably. From 2020 to 2024, gold ETFs shed 31 million ounces, or 25% of their holdings, as investors sold both bullion and equities. The largest gold stock ETF, the GDX, experienced consistent outflows amounting to nearly 20% of its assets. This is reminiscent of past cycles; between 2012 and 2015, as real rates rose from -0.20% to 0.80%, gold ETFs liquidated 36 million ounces.
Yet this rate hike cycle has a critical difference: for the first time in decades, central banks have emerged as significant buyers of gold. Between 2020 and 2024, central banks accumulated an estimated 106 million ounces of gold, more than offsetting the liquidation by Western investors. Consequently, despite the sharp rise in real interest rates, gold has nearly doubled. Unfortunately for gold mining executives, central banks are interested in gold bars, not gold shares. With no natural buyer to counteract Western selling, gold equities have been left in the dust, now trading at historically low valuations.
As contrarian value investors, we see extraordinary opportunity in this disparity and have been increasing our positions in gold equities. A common question we encounter is whether some fundamental change has occurred within the gold mining industry to justify this extreme undervaluation. Specifically, there’s concern that rising costs have eroded the profit margins that should have expanded with the rising gold price.
While comparing the HUI with gold is a useful exercise, it doesn’t capture the full picture of the gold mining sector’s underlying health.
To gain clarity, we’ve constructed an index* of six major gold producers: Newmont, Barrick, Harmony, Goldfields, and Agnico Eagle. Together, these companies produce 17 million ounces of gold and hold 343 million ounces of proven reserves, giving them a combined reserve life of 20 years. With a collective enterprise value of $130 billion, these companies represent nearly 40% of the entire industry. Crucially, they all have financial records dating back to at least 2000, allowing us to compare current undervaluation with past extremes.
Consider the bear market bottom of 1999. Following two decades of inflation and the end of the Bretton Woods system, gold peaked at $850 per ounce in January 1980, only to lose 79% of its value over the next 19 years, bottoming at $252 in August 1999. The Barron’s Gold Stock Index (the precursor to the HUI) mirrored this decline, falling 84% before also bottoming in 1999.
In 1999, our six companies produced 12 million ounces of gold at an average cost of $200 per ounce. With gold averaging $279 for the year, these companies generated a combined adjusted EBITDA of just $1 billion. Their combined net asset value (NAV), calculated using a discounted cash flow (DCF) model with a 10% discount rate and $292 gold price, was $9 billion, compared to an enterprise value of $15 billion, implying a multiple of 1.8x.
At market lows, it’s also helpful to compute a company’s “real option value” alongside its DCF. When commodity prices are depressed, a company’s profitability—and hence its DCF value—may appear negligible or negative. However, if investors anticipate a rise in the commodity’s price, the stock can be viewed as a series of call options. The underlying asset is the gold price, the strike price is the cash cost of production, and the quantity is the expected annual production. Using Black-Scholes, we can estimate this option value and discount it to the present. In 1999, the combined real option value of our six companies was nearly $18 billion, against an enterprise value of $15 billion, suggesting they traded at 0.80x their real option value.
Another useful measure is the enterprise value per ounce of proven reserve, compared to the gold price. In 1999, the companies had 240 million ounces of proven reserves and a combined enterprise value of $15 billion, or $61 per ounce of proven reserve. This meant that investors could buy gold in the ground for just 23% of the spot price.
Fast forward to 2011, when gold had soared nearly eightfold to $1,900 per ounce. The HUI index rose sixteen-fold from 38 to nearly 600, while the market capitalization of the industry surged from $5 billion to $253 billion. At the market’s peak in 2011, gold miners accounted for nearly 2% of the S&P 500, up from just 0.4% in 2002.
The six companies saw their enterprise value rise eightfold from $15 billion to $115 billion. Was this justified? Their combined revenues increased eightfold—consistent with both the gold price and their enterprise value. Despite rising costs, EBITDA grew nearly sevenfold from $2 billion to $13 billion. Their NAV, as measured by DCF using a 10% discount rate and $1,600 gold price (the 2011 average) increased sixteen-fold from $10 billion to $160 billion, far outpacing the rise in their enterprise value. The companies’ real option value also surged. From $18 billion in 1999, their option value grew ninefold to $200 billion by 2011.
The years following 2011 were brutal for gold stocks. By late 2015, gold had dropped nearly 50% to $1,051 per ounce, and the HUI had plummeted 85%, from 635 to 104. The market capitalization of gold miners fell from $253 billion to just $54 billion, shrinking from 2% to 0.3% of the S&P 500.
Our index’s equity value declined by 73% during this period, as production fell by nearly 20%, revenues by 40%, and costs rose by 22%. The companies’ DCF valuation dropped by 65%, using a 10% discount rate and $1,160 gold price while their real option value halved. By 2015, the companies’ enterprise value had dropped to $40 billion—equivalent to 70% of their DCF value and just 0.40x their real option value. With 275 million ounces of proven reserves, the enterprise value per ounce was $150, or 12% of the spot price.
The bear market that ended in 2015 was a time of extreme undervaluation, providing an excellent opportunity for contrarian investors. Indeed, over the next five years, gold stocks surged by 218%, far outpacing the S&P 500, which gained 75%, and even the tech-heavy Nasdaq, which rose by 146%.
Today, we find ourselves at a similar juncture. Gold has rallied from its 2015 low of $1,051 to an all-time high of $2,500, while the HUI has risen from 100 to 312. Yet despite this, the market capitalization of gold miners remains at $220 billion, which is the same as it was in 2011 despite the fact that gold is 35% higher and the S&P 500’s market capitalization is four times greater. Gold stocks now make up just 0.50% of the S&P 500, a figure reminiscent of the market bottom in 2015 rather than speculative tops.
Our index of six companies has seen their enterprise value grow by 150% since 2015, while their production has increased by only 10%, revenues have doubled, and EBITDA has grown sixfold. Their NAV has tripled, using a 10% discount rate and $2,200 gold price and their real option value has risen by a similar magnitude. Despite this, they currently trade at just 0.60x their DCF value and 0.38x their real option value—levels not seen since 1999.
At the most extreme reading earlier this year, these companies were valued at just $292 per ounce of proven reserve, or 12% of the spot price—again, the lowest on record.
By April 2024, gold stocks were as cheap as they have ever been. The only comparable period is the market bottom in 2015. However, unlike 2015, gold is now at an all-time high. Back then, a value investor had to anticipate a rise in the gold price to justify an investment in gold equities. That is not the case today. Moreover, in 2015, the industry’s profit margins were slim—just 12%. Today, they are nearly 40%. From an operational standpoint, the margin of safety is much greater now than it was in the past.
In essence, gold equities today offer an unprecedented combination of low valuation and high potential return. Normally, when a commodity reaches new highs, investor interest is intense and valuations are stretched. Yet in the case of gold stocks, investor interest remains muted. Even as gold has rallied, investors have continued to withdraw funds from gold equity ETFs, with $1.5 billion redeemed from the GDX thus far in 2024—a testament to the widespread disinterest in the sector.
While recent gains in gold stocks may be attributed to short-covering rather than renewed enthusiasm, the underlying value proposition is clear. In an environment where gold is hitting new highs, yet gold equities remain deeply undervalued, astute investors should take note. The current opportunity is as compelling as any we’ve seen in the history of the gold market.
Intrigued? We invite you to download or revisit our entire Q2 2024 research letter, available below.
2024 INVESTOR DAY took place on Monday, October 21: "Geopolitics, War, and Commodities." A replay is available of this event by visiting https://conference.gorozen.com

Disclosures:
The index of six major gold producers cannot be invested in and is constructed by G&R for illustrative purposes only.
Registration with the SEC should not be construed as an endorsement or an indicator of investment skill, acumen or experience. Investments in securities are not insured, protected or guaranteed and may result in loss of income and/or principal. Historical performance is not indicative of any specific investment or future results. Investment process, strategies, philosophies, portfolio composition and allocations, security selection criteria and other parameters are current as of the date indicated and are subject to change without prior notice. This communication is distributed for informational purposes, and it is not to be construed as an offer, solicitation, recommendation, or endorsement of any particular security, products, or services. Nothing in this communication is intended to be or should be construed as individualized investment advice. All content is of a general nature and solely for educational, informational and illustrative purposes. This communication may include opinions and forward-looking statements. All statements other than statements of historical fact are opinions and/or forward-looking statements (including words such as “believe,” “estimate,” “anticipate,” “may,” “will,” “should,” and “expect”). Although we believe that the beliefs and expectations reflected in such forward-looking statements are reasonable, we can give no assurance that such beliefs and expectations will prove to be correct. Various factors could cause actual results or performance to differ materially from those discussed in such forward-looking statements. All expressions of opinion are subject to change. You are cautioned not to place undue reliance on these forward-looking statements. Any dated information is published as of its date only. Dated and forward-looking statements speak only as of the date on which they are made. We undertake no obligation to update publicly or revise any dated or forward-looking statements. Any references to outside data, opinions or content are listed for informational purposes only and have not been independently verified for accuracy by the Adviser. Third-party views, opinions or forecasts do not necessarily reflect those of the Adviser or its employees. Unless stated otherwise, any mention of specific securities or investments is for illustrative purposes only. Adviser’s clients may or may not hold the securities discussed in their portfolios. Adviser makes no representations that any of the securities discussed have been or will be profitable. Indices are not available for direct investment. Their performance does not reflect the expenses associated with the management of an actual portfolio.