
The article below is an excerpt from our Q3 2025 commentary.
We spent the early days of October zig-zagging across New Zealand and Australia, where every meeting seemed to begin—and often end—with the same subject. Gold, gold, and more gold. The fever was unmistakable. With the metal sailing through record highs in 2024 and 2025, investors wanted reassurance, explanation, prediction—anything that might make the ascent feel less like scaling a sheer rock wall without a rope.
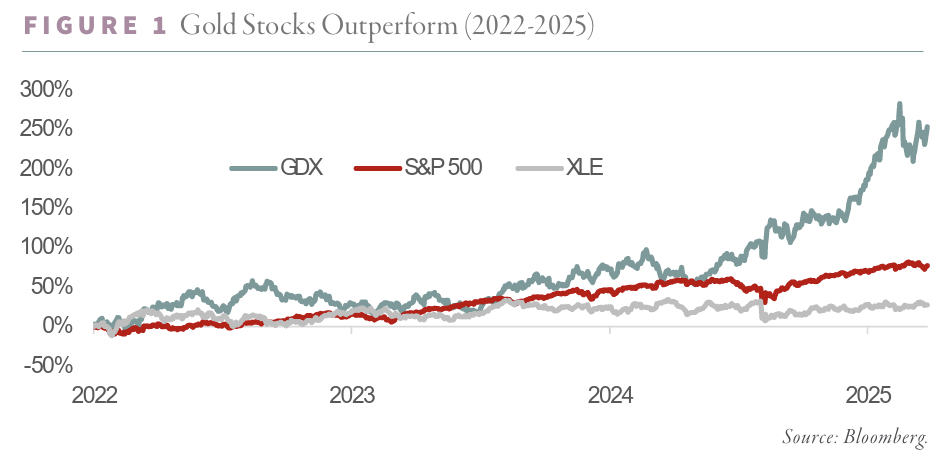
For followers of Goehring & Rozencwajg, little of this should have come as a surprise. For three years we had argued—some might say pleaded—that a major gold bull market was approaching. Weakness in the metal or in gold equities, we insisted, was not a warning to sell but an invitation to buy. And those who accepted that invitation were rewarded handsomely.
Back in the fourth quarter of 2022, we were already telling readers that the next leg of the bull market was drawing close. A year later, in our second-quarter 2023 letter, with the turn still nine months away, we imagined a dinner party set in December 2029. Two groups of guests animated the scene. One group toasted their good fortune—faithful accumulators of precious metals. The other sat brooding, their portfolios—stuffed with the great growth darlings of the preceding decade—now offering none of the comfort they once promised. Gold, we wrote, would emerge as the standout asset of the decade, regardless of how the economy or geopolitics twisted around it.
We backed that vision with modeling suggesting materially higher gold prices under almost any plausible financial scenario. And as the bull market finally began stirring in 2023, we emphasized how anomalously cheap gold equities had become—valuations as depressed as anything seen at the depths of the early-2000s bear market. The opportunity was as plain as it was rare.
The last three years validated that conviction. Gold—and more strikingly, gold equities— outperformed almost everything else, as any glance at the comparative charts will reveal.
We remain constructive on precious metals and maintain our exposure today. But success also bears a responsibility: to look clear-eyed at the landscape ahead, and to recognize when leadership in natural resources is beginning to shift.
And now, we believe, that shift is underway.
A Familiar Turning: Gold Leads, Oil Follows
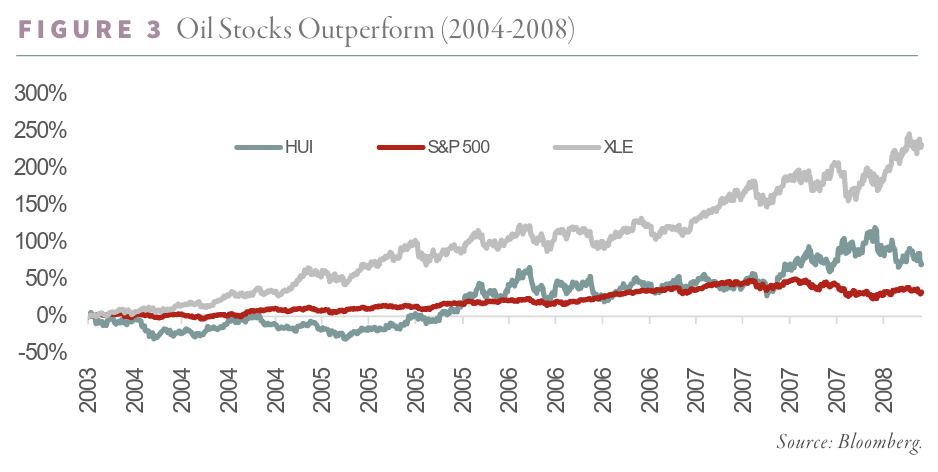
In the early 2000s, long before commodities became fashionable dinner-table conversation, a similar baton pass occurred. Gold led the resource market from 1999 through 2003. Then, abruptly and emphatically, oil took over. From 2004 through 2008, crude became the market’s leader, and investors who increased their energy exposure were rewarded many multiples over.
The conditions that produced that handoff were not widely understood at the time. Few noticed the subtle but decisive slowing in non-OPEC production. Fewer still appreciated how concentrated the world’s marginal supply had become. By the time the market caught on, oil prices were well into their ascent.
We believe the same forces are gathering today. Gold continues to enjoy a powerful long-term setup, and we remain enthusiastic owners. But the balance of opportunity, in our view, is beginning to tilt. This is not a call to abandon gold—it is a call to raise one’s exposure to oil.
When Gold Was Left for Dead
To appreciate the present, it helps to remember the late 1990s, when gold had truly become an uninvestible asset class. From its 1980 peak at $850, the metal had slumped for two decades, bottoming at $252 in 1999. Central banks—especially in Europe—were unloading their holdings, convinced that gold had been permanently unseated by yield-bearing assets. This was the era of gold’s “demonetization,” when bankers spoke confidently about selling down their reserves over 30 years.
The frenzy became so intense that the IMF, nudged by the U.S. Treasury, stepped in to coordinate sales through what became known as the Washington Agreement—an attempt to prevent central banks from front-running one another as they sprinted for the exits.
Producers took their cues from the bankers. Armed with fresh derivative tools and encouraged by the ability to borrow physical metal from the very institutions that were selling it, miners began hedging production years into the future. Barrick famously sold forward 20 million ounces—six years of output. Some Australian producers sold forward more than a decade’s worth of production despite possessing only seven years of proven reserves. It was a strategy that worked beautifully until it didn’t. When prices finally turned, companies were crushed under liabilities now exploding in their own hedge books. Barrick’s unwind alone cost the company $6 billion—a good portion of the Australian gold mining industry went bankrupt.
And as if central banks and producers weren’t flooding the market with enough supply, bullion banks piled on—borrowing gold from central banks and selling into the market ahead of the very producers whose hedges they were arranging.
The result produced an asset that had not only been cast aside but had now become severely mispriced. Measured in what it could buy—including GDP-deflator baskets or even median house prices—gold sat at a historic low. At one point in the early 2000s, an ounce of gold bought fewer than eight barrels of oil, a ratio reached only three times in 170 years.
A few investors recognized the imbalance. In July 2000, Forbes ran a profile titled “Gold at $2,500?”, highlighting my view that gold was deeply undervalued. It was an unfashionable view at the time, though ultimately a prescient one. Within a year, gold and gold equities began an extraordinary period of outperformance.

When Oil Took the Mantle
But the wheel turned again. By 2003, oil had become the market’s outcast. The Economist 0101emblazoned its October cover with “The End of the Oil Age,” capturing the mood of the era—a world reeling from the aftershocks of September 11 and convinced that energy demand was set for terminal decline.
Yet beneath the surface, the seeds of a powerful rally were already sprouting. Non-OPEC supply growth was faltering. Decline rates were accelerating. Spare capacity was shrinking. And as the disconnect between perception and reality widened, oil set the stage for a historic bull run.
In January 2004, Barron’s profiled my view that oil prices were poised to rise—not fall— because supply growth was quietly stalling. Within months, the thesis played out. Oil quadrupled over the next four years, and energy stocks led markets with a ferocity rarely seen before or since.
What Echoes Today
We recount these episodes not to relive old victories but to remind investors that history often rhymes in natural resource markets. Narratives swing to extremes, supply signals get ignored, and capital flows chase what has already happened rather than what is coming next.
Which brings us to today’s fashionable pessimism—this time directed at oil.
For years, the International Energy Agency (IEA) published increasingly confident forecasts that electric vehicles would march inexorably upward and oil demand would soon plateau. Recently, the IEA has softened its language, but the long shadow of those predictions still shapes investor sentiment. Many now accept, almost as reflex, that oil is a shrinking business.
Our research suggests otherwise. In fact, EV adoption—once assumed inevitable and universal—is already showing signs of plateauing in several markets. We believe the long-term growth rate will fall meaningfully short of consensus expectations. Whether or not EVs dominate by 2035 is less important than acknowledging that demand for oil remains far more resilient than the narrative implies.
Meanwhile, oil has undergone the same treatment gold suffered in the late 1990s: declared obsolete, dismissed as uninvestable, and traded down to levels that defy historical comparison. In gold terms, oil has fallen nearly 90% in a quarter-century. As recently as three weeks ago, an ounce of gold bought 76 barrels of oil, surpassed only during the COVID-19 pandemic.1
In 2004, when the last oil bull market began, the gold-oil ratio stood around 12. Today it is roughly 65. Energy’s weight in the S&P 500 has fallen from 6% then to under 3% now. Oil is cheaper and more under-owned than it was on the eve of its last great rally.
At the same time, the supply dynamics that triggered that earlier surge are again coming into focus. Non-OPEC production growth is slowing, and depletion is accelerating in ways that echo the early 2000s. The underlying machinery is familiar—and so is the market’s refusal to acknowledge it.
A Rotation in Motion
Put simply: gold remains strong, but oil is stirring. And for investors concerned with relative performance—a crucial constraint for many institutions—the case for raising energy exposure grows stronger by the quarter. This is not a call to sell gold completely. We continue to believe the long-term prospects for precious metals are robust. But as in 2003, leadership is shifting—and investors who adjust their exposure rather than cling to past winners may once again find themselves rewarded for seeing what others overlook.
Curious to learn more now? Read more in our Q3 2025 research newsletter, available for download below.

1The negative price recorded for the NYMEX May 2020 WTI contract reflected an exchange-level failure to clear positions before delivery constraints became binding. Storage at Cushing was effectively full, open interest unusually high, and forced liquidation produced the now-infamous negative print. Brent, a financially-settled contract, closed at $19.33 on April 21 and offers a truer representation of market pricing. Using that figure against gold at $1,690 per ounce yields a gold-oil ratio of 87 during the crisis.
Registration with the SEC should not be construed as an endorsement or an indicator of investment skill, acumen or experience. Investments in securities are not insured, protected or guaranteed and may result in loss of income and/or principal. Historical performance is not indicative of any specific investment or future results. Investment process, strategies, philosophies, portfolio composition and allocations, security selection criteria and other parameters are current as of the date indicated and are subject to change without prior notice. This communication is distributed for informational purposes, and it is not to be construed as an offer, solicitation, recommendation, or endorsement of any particular security, products, or services. Nothing in this communication is intended to be or should be construed as individualized investment advice. All content is of a general nature and solely for educational, informational and illustrative purposes. This communication may include opinions and forward-looking statements. All statements other than statements of historical fact are opinions and/or forward-looking statements (including words such as “believe,” “estimate,” “anticipate,” “may,” “will,” “should,” and “expect”). Although we believe that the beliefs and expectations reflected in such forward-looking statements are reasonable, we can give no assurance that such beliefs and expectations will prove to be correct. Various factors could cause actual results or performance to differ materially from those discussed in such forward-looking statements. All expressions of opinion are subject to change. You are cautioned not to place undue reliance on these forward-looking statements. Any dated information is published as of its date only. Dated and forward-looking statements speak only as of the date on which they are made. We undertake no obligation to update publicly or revise any dated or forward-looking statements. Any references to outside data, opinions or content are listed for informational purposes only and have not been independently verified for accuracy by the Adviser. Third-party views, opinions or forecasts do not necessarily reflect those of the Adviser or its employees. Unless stated otherwise, any mention of specific securities or investments is for illustrative purposes only. Adviser’s clients may or may not hold the securities discussed in their portfolios. Adviser makes no representations that any of the securities discussed have been or will be profitable. Indices are not available for direct investment. Their performance does not reflect the expenses associated with the management of an actual portfolio.