Intro
Oil and oil-related equities collapsed this week, in what can only be described as extreme panic selling. WTI prices have fallen 30% since October 3rd, erasing all of the gains of the last twelve months. Brent prices have fallen 26% to reach the lowest levels since March. In our many years of writing, we have never issued an “Interim Special Report” but given the severity of the bearishness we felt it was appropriate.
Our models tell us that the market action over the past week has provided truly long-term contrarian investors with the potential buying opportunity of a lifetime.
In today’s brief report, we would like to explain:
- Why we believe oil prices have been weak.
- Where the sell-off has left us today.
- How we think the fundamentals will change over the next twelve months.
It has been a very frustrating time, but the opportunity offered today is extreme, and all of our readers must properly understand the underlying supply and demand dynamics in order to properly decide how to proceed.
How Oil Markets Got Here
In May, the US announced sanctions on Iran that were expected to impact their crude exports by 1-2 million b/d. Over the summer, bullish forces gripped global crude markets as analysts realized it would be impossible to replace this production. As inventories continued to decline, oil prices moved steadily higher.
Saudi Arabia, responding to a series of tweets from the President among others, decided to act in its unofficial role as swing producer. Immediately following the announcement of sanctions in May, Saudi Arabia increased production from 9.97 million b/d to 10.68 million b/d in October. Since the Iranian sanctions were not due to start until November, total OPEC production increased by a very large 1.5 million b/d over that same period.
In an unexpected move, the US administration last week announced that it would issue sanction waivers for eight of Iran’s key oil buying countries: China, India, South Korea, Japan, Italy, Greece, Taiwan and Turkey. These countries account for 75% of Iran’s oil exports and would be granted a waiver for 180 days. While the administration may certainly change course yet again, it now seems as though the impacts of the Iranian sanctions will be largely (if not entirely) muted.
This announcement caught oil-markets off guard and precipitated the most recent bout of selling pressure. WTI prices had already fallen from $76 per barrel to $65 ahead of the announcement, but the rolling back of sanctions caused oil to break several key technical levels and prices plummeted as a result.
Saudi Arabia seems to have been caught off-guard by this development as well. As soon as the Iranian sanction waivers were announced, Saudi Arabia announced they would cut production (which we believe were only boosted to offset the Iranian sanctions in the first place). This latest episode marked only the third time Saudi Arabia ever produced above 10.5 million b/d, and each of the last two times (2015 and 2016), they promptly throttled back supply to help rest their aging fields. This view is shared by many in the industry who believe that producing above 10.5 million b/d is extremely taxing on the Saudi Arabian reservoirs. While the Kingdom was willing to push production to fulfill its role as swing producer, we cannot see why they would maintain production once the sanctions have been rendered moot.
Throughout the summer, the surge in OPEC production caused inventory draws to first moderate and then to actually build relative to seasonal averages. While this suggests the oil market was in moderate surplus, we should point out it would have been nearly impossible to expect anything else given the massive 1.5 million b/d increase in OPEC production (an increase which OPEC is considering rolling back). This build-up was designed to partially mitigate the impacts of Iranian sanctions and avoid a full-blown price melt-up.
Despite this surge in OPEC production, OECD inventories remain low. In February 2016, inventories were 450 million bbl above their 10-year seasonal averages. Back then, we accurately predicted they would repair themselves over the next two-years. By May of this year 90% of the overhang was gone and inventories were 50 million bbl over seasonal-averages. Even with the huge surge in OPEC production over the summer, inventories were only 55 million bbl above seasonal averages by the end of August (the most recent data available).
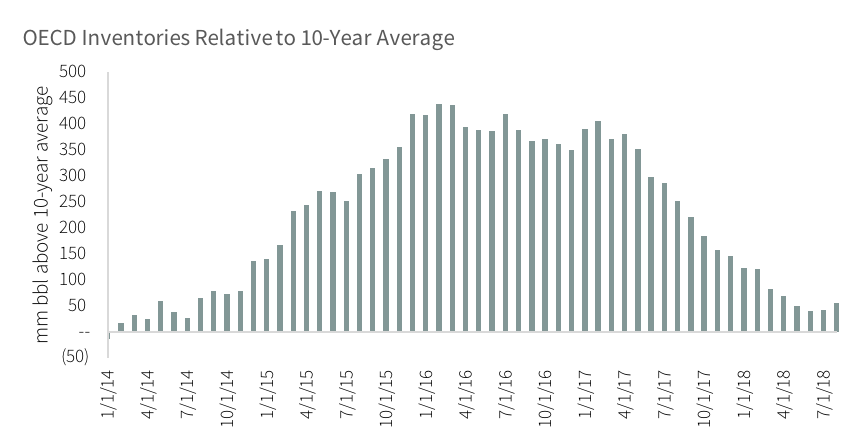
Source: International Energy Agency
Already some market watchers are comparing this to the 2014/2015 period when OPEC produced at full-capacity, swelled inventories and then agreed to cut supply. However, this time inventories hardly built at all relative to seasonal averages, and today we are in a much healthier position than we have seen in years.
Many analysts are blaming the moderate surplus on rising US shale production or weakening global demand. While we continue to monitor both of these factors closely, we continue to believe that shale growth alone will not be able to meet growing demand and slowing conventional non-OPEC production. Instead, the recent sell-off was the result of a huge surge in OPEC production that was ultimately not needed. Wether OPEC made a mistake or was duped remains an open question, but now that the Iranian sanctions have been de-fanged we are not surprised to see OPEC considering rolling back production.
Where the Sell-Off Has Left Us
For those willing to do the work, we believe this sell-off has presented inventors with extreme value. After Tuesday’s 7% decline, WTI futures are now the most over-sold ever (14-day RSI) according to Capital One. Oil volatility meanwhile has picked up to levels not seen since the 2016 lows, according to Jeff DeGraff of Renaissance Macro.
The equities also appear to be under massive liquidation. Many names we look at are approaching their lows made in 2016, despite the fact that oil prices have more than doubled. The energy weighting in the S&P 500 is now 5.3% -- the lowest reading in eighteen years. This measure has been an excellent predictor of future energy-related equity performance and we would expect the same this time as well.
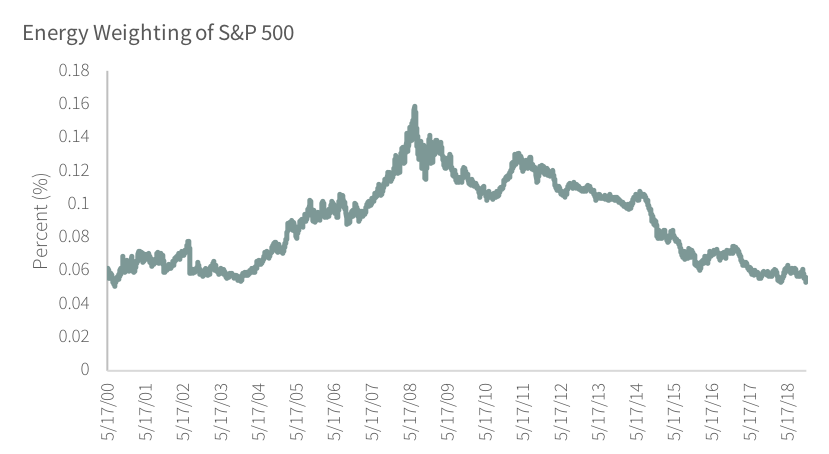
Source: Bloomberg
The sell-off has been indiscriminate and feels to us like a capitulation bottom. There have been reports that a large hedge-fund is unwinding its long-crude short-natural gas trade and that this has only exaggerated the move lower. Looking at the chart of oil to gas prices certainly helps to back up this view.
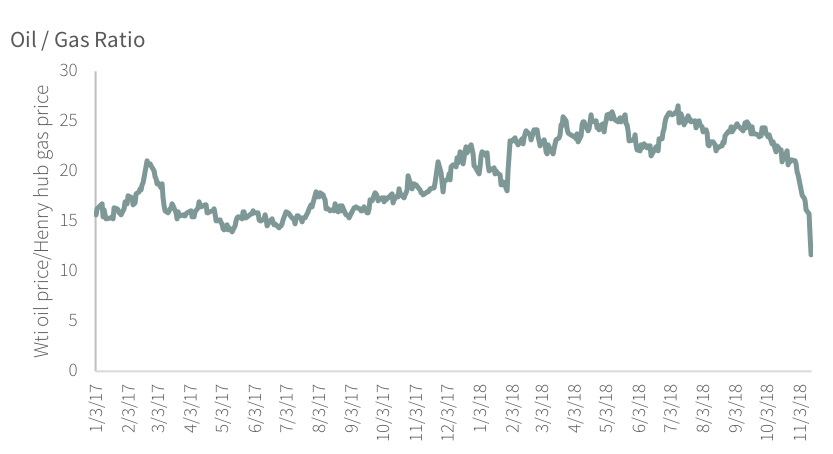
Source: Bloomberg
Energy-related investments today represent the best value we have seen in over twenty years. Despite the steady improvement in fundamentals and oil prices, the relative valuation of energy stocks vs. the S&P 500 is now at an all-time low. The recent events in OPEC (perhaps exaggerated by fund liquidation as mentioned above) have all come together to create nearly unprecedented value. We have often said that we are contrarian investors that like to get involved in markets where investor sentiment is negative and yet fundamentals have turned positive. After the recent sell off, the energy related markets today offer the best value we have seen in nearly twenty years (if not ever).
Learning From History
Today reminds us of the 1998-2002 period. If we are right, then this week’s sell-off will be an excellent buying opportunity. Twenty years ago, oil prices bottomed at $10.72 per barrel and rallied 250% over the next two years. Energy equities lagged the oil price but still rallied a respectable 70%. At that point, oil prices retraced a large part of their advance and fell 53% finally bottoming in late 2001. Energy equities meanwhile fell 41% and actually made a new low in early 2002 (despite oil prices still being 70% higher than the 1998 lows).
Bearish sentiment had reached unsustainable levels, and positive changes in the fundamentals propelled oil prices up seven-fold over the next seven-years. Those investors that were shaken out of their positions as energy-equities made new lows in 2002 missed a 400% rally (32% CAGR) over the next six years.
While history doesn’t repeat itself, it certainly does rhyme, and we believe what we’re seeing today is a bearish capitulation that is shaking weak hands out of the energy markets and setting up for the next leg much higher in energy markets.
2019 Outlook
In our last quarterly letter, we outlined our views for 2019 balances but given the recent weakness we wanted to reiterate them again here. In their latest report, the IEA expects 2019 global demand to average 100.6 million b/d. We expect this figure will be revised higher, due to the persistent balancing item (or missing barrels) that has averaged 500,000 b/d this year. This balancing item is almost always underestimated demand, and so we expect 2019 oil demand to reach 101.1 million b/d.
The IEA expects 2019 non-OPEC oil supply to reach 62.3 million b/d, based upon US growth of 1.3 million b/d and non-OPEC growth outside of the US of 620,000 b/d. We have explained why we believe non-OPEC growth ex-US will continue to disappoint given a huge reduction in capital spending outside of the shales. Already for 2018, non-OPEC ex-US production growth has been revised lower from ~600,000 b/d to 230,000 b/d. As a result, we expect 2019 figures to be revised down as well and for total non-OPEC production to ultimately average only 61.8 million b/d in 2019.
Assuming 7.0 million b/d of OPEC NGLs, we expect the so-called call-on-OPEC to average 32.3 million b/d. In October 2018, OPEC produced at 32.99 million b/d, however, as we discussed this was done in an attempt to make up for expected production lost to Iranian sanctions. As recently as May, OPEC produced at 31.8 million b/d – or 500,000 b/d below next year’s call. Saudi Arabia has signaled that it would cut production by 500,000 b/d in December, which would result in a balanced oil market for 2019.
Furthermore, the Saudi energy minister signaled he would try to get other OPEC members to agree to an additional 500,000 b/d cut at the December meeting. If they are successful (and we believe they will be), then oil inventories will begin declining again shortly, sending oil prices once again higher.
We cannot remember selling pressure as intense as we have seen over the last few weeks, but for those investors who are able to adopt a contrarian stance, take the time to understand the fundamentals, and stomach the volatility. We believe you are being presented with an excellent investment opportunity.