
The article below is an excerpt from our Q4 2023 commentary.
Five years ago, we became uranium bulls. We explained how the market had quietly slipped into a structural deficit, with reactor demand outstripping mine supply. Fuel buyers used so-called “secondary supplies” to fill the gap -- notably large commercial stockpiles accumulated following the 2011 Fukishima nuclear accident. At the time, investors did not pay uranium any attention at all. The premiere Western uranium producer, Cameco, changed hands at $9 per share – 20% below its tangible book value – and held nearly $800 mm of cash on its balance sheet. By the first quarter of 2019, no uranium company on any exchange sported a double-digit stock price – a sign that investors had given up on the industry. Investor attitude is entirely different today. Bloomberg consistently reports on structural deficits. Instead of trading for $9, a share of Cameco now changes hands for more than $50.
Why start our natural gas essay with a discussion of uranium?
We believe today’s North American natural gas market resembles that uranium market: despite widespread investor pessimism, it too is about to slip into “structural deficit”. Careful research and a differentiated outlook may reward the enterprising natural gas investor just as large profits accrued to the uranium investor back in 2018.
North American natural gas collapsed after peaking at nearly $10 per mmbtu in August 2022. Many analysts point to surging supply; however, this fails to capture the whole story. In June 2022, the Freeport LNG export terminal on Quintana Island, Texas, caught fire, halting operations. The terminal did not resume full output until March 2023. Freeport exported two bcf/d, representing nearly 2% of total US demand. We estimate the fire affected about 600 bcf of export demand over the 100 days the terminal remained closed. As a result, US natural gas inventories grew by 700 bcf compared with long-term seasonal averages between June 2022 and March 2023 – 85% of which was attributable to the Freeport fire. Making matters worse, the 2022/2023 North American winter was the fourth mildest since records began 130 years ago.
Once Freeport resumed operations, natural gas inventories began to draw sharply. By the end of the injection season on November 1st, 2023, nearly 90% of the excess inventory had been worked off. Unfortunately, the start of the 2023/2024 withdrawal season has been mild again. Since November 1st, North American temperatures have consistently registered 10% warmer-than-normal, reducing heating demand and swelling inventories relative to normal.
North American storage sits nearly 250 bcf above seasonal averages, driving prices back to $2.23 per mmbtu – nearly 80% below its energy equivalent compared with oil and seaborne gas.
Although weather explains most of the recent inventory glut, many analysts blame growing production, which we believe to be incorrect. For the past decade, three fields have been responsible for nearly all US natural gas supply growth: the Marcellus, Permian, and Haynesville. These three basins represent almost 60% of total US gas production. After such prolific growth, most analysts seem to believe these fields will grow forever. We disagree. Instead, our models suggest US production will experience unanticipated declines over the next several years. We believe enough data exists to attempt to model future US shale gas production, and the conclusions are dire. Using our proprietary neural network, we have estimated the major shale basins’ Tier 1 drilling inventory and expected ultimate basin recovery. Like a sizeable conventional field, we believe that a shale basin’s production will peak when half its recoverable reserves have been produced. Furthermore, we can monitor ongoing drilling productivity in real time to help confirm we are traveling down the right path. Our models conclude that the Marcellus, Haynesville, and Permian are plateauing and each could experience declines within the following year. By 2026, we expect these fields will resemble two of the earliest shale fields – the Barnett and Fayetteville.
 Our neural network helped us identify two indicators hinting at forthcoming production declines. First, we can estimate when producers will have produced half by estimating a field’s ultimate recoverable reserves. Historically, this has correlated very well with a basin’s maximum production rate. Next, we evaluate how many of a basin’s most prolific wells (so-called Tier 1) producers have drilled. Based upon historical precedents in the Barnett, Fayetteville, Eagle Ford, and Bakken, we observe that production begins to decline once operators have drilled 60% of the best wells.
We find it helpful to monitor a real-time indicator of basin health. If a field is about to decline, we should expect its average well productivity to fall, suggesting its top Tier 1 wells inventory has been mostly exhausted. Observing two consecutive years of sustained productivity declines increases our confidence that our estimate of Tier 1 inventory was correct.
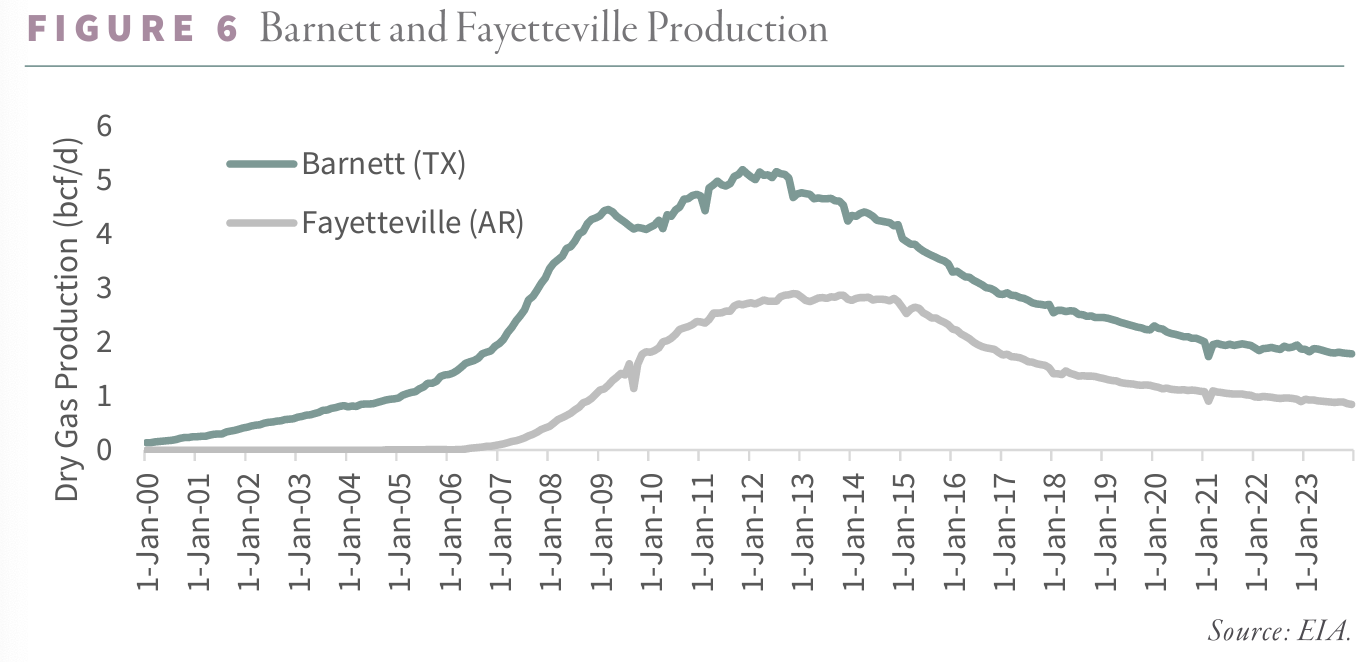
How did our framework do with the Fayetteville and Barnett – the first two shale gas basins to peak and roll over? In the case of the Fayetteville, our neural network suggests the basin will ultimately recover ten tcf. A Hubbert Linearization, an older reserve estimation technique, arrives at a similar figure. Just as our theories would predict, the Fayetteville peaked at 3.0 bcf/d once half of the ultimate recoverable reserves were produced. Production started declining sharply once 60% of our estimated Tier 1 wells were drilled. In the Barnett, our neural network estimated total recoverable reserves of 23 tcf—a figure again confirmed using a “Hubbert Linearization.” Just like the Fayetteville, production peaked in 2012 at 5.0 bcf/d, once half the reserves had been produced, and 60% of the best wells had been drilled. The Fayetteville and Barnett helped us properly calibrate our understanding of shale basins and inform our views of the Marcellus, Permian, and Haynesville.
Our neural network predicts that the Marcellus and Haynesville will ultimately recover 130 and 75 tcf, respectively. A Hubbert Linearization of the Marcellus confirms this estimate. Unfortunately, a similar analysis of the Haynesville is more challenging. Haynesville production peaked in 2012 at 7.5 bcf/d, declined over the next three years due to low prices, and staged a second material ramp-up. The Haynesville’s irregular profile makes a traditional Hubbert Linearization difficult; however, our neural network works off actual well data and is immune from such disruptions.
By mid-2022, the Marcellus had produced 68 tcf – slightly more than half its ultimate recoverable reserves. From 2012 to 2022, Marcellus dry gas production grew on average by 2.1 bcf/d per year. Since mid-2022, annual growth has only averaged 0.1 bcf/d – a 95% slowdown. By late 2023, the Haynesville had produced 38 tcf, equivalent to half of its recoverable reserves. From 2018, when it began its second production surge, until August 2023, Haynesville growth has averaged 1.8 bcf/d per year. Since August, growth has slowed by 77% to only 340 mmcf/d annualized. Our framework suggests field depletion in both major basins is responsible for the slowdown. We do not believe the Haynesville will be able to start growing again, unlike what happened back in 2017. When the Haynesville first peaked in 2012, it had produced less than 10% of its recoverable reserves. If we had our models back then, we would have known the field could stage a massive recovery. No such luck this time. Instead, we believe the Marcellus will turn from plateau to outright decline within a few months. In the Haynesville, we expect 2024 production will only grow modestly before declining sequentially later this year.
The remaining Tier 1 inventory serves to confirm our prediction. The Barnett and Fayetteville moved from plateau to decline once operators drilled 60% of their best wells. Presently, operators in both the Marcellus and Haynesville have also drilled 60% of their best locations. As a result, we expect the Marcellus will soon begin to decline. Moreover, the Haynesville may move more quickly from slowing growth to plateau and ultimately decline sooner than we expect.
Real-time well productivity data further confirms our outlook. In the Barnett and Fayetteville, drilling productivity peaked and declined twenty-fours months before the field reached maximum output, respectively. Productivity in both the Marcellus and Haynesville peaked in 2021 and has since slowed by between 15 and 20%. Production declines are imminent if the Marcellus and Haynesville follow the Barnett and Fayetteville.
Growth in associated gas production from the Permian is slowing rapidly as well. For those interested, please refer to our 1Q23 essay: “The Permian Is Depleting Faster Than We Thought.” We will also release a video analysis of the Permian in the coming months.
Analysts remained fixated on the continued year-on-year growth in US gas production; however, few have commented on how quickly the growth has slowed.On a year-on-year basis, US dry gas production decelerated from six bcf/d to slightly over two bcf/d.
Regarding demand, LNG export capacity will increase by six bcf per day over the next twelve months. All of this new demand is fully permitted and currently under construction. None is subject to the Biden administration’s recent proposed moratorium on new LNG terminals, which only applies to future planned projects. Our modeling suggests dry gas production will not be able to meet the new demand. As a result, we expect the US natural gas market will slip from surplus to deficit sometime later this year. With international gas trading for $12 per mmbtu (four times the domestic price), traders will aggressively bid US prices higher to take advantage of the arbitrage.
As always, the weather remains a wild card. However, even if the remainder of the North American winter is mild, we believe the market will become tighter within twelve months. Any weather-related weakness presents an excellent buying opportunity. North American gas today resembles uranium in 2018: the market is about to shift from surplus to deficit, yet investors remain bearish.
Intrigued? We invite you to download or revisit our entire Q4 2023 research letter, available below.

Registration with the SEC should not be construed as an endorsement or an indicator of investment skill, acumen or experience. Investments in securities are not insured, protected or guaranteed and may result in loss of income and/or principal. Historical performance is not indicative of any specific investment or future results. Investment process, strategies, philosophies, portfolio composition and allocations, security selection criteria and other parameters are current as of the date indicated and are subject to change without prior notice. This communication is distributed for informational purposes, and it is not to be construed as an offer, solicitation, recommendation, or endorsement of any particular security, products, or services. Nothing in this communication is intended to be or should be construed as individualized investment advice. All content is of a general nature and solely for educational, informational and illustrative purposes. This communication may include opinions and forward-looking statements. All statements other than statements of historical fact are opinions and/or forward-looking statements (including words such as “believe,” “estimate,” “anticipate,” “may,” “will,” “should,” and “expect”). Although we believe that the beliefs and expectations reflected in such forward-looking statements are reasonable, we can give no assurance that such beliefs and expectations will prove to be correct. Various factors could cause actual results or performance to differ materially from those discussed in such forward-looking statements. All expressions of opinion are subject to change. You are cautioned not to place undue reliance on these forward-looking statements. Any dated information is published as of its date only. Dated and forward-looking statements speak only as of the date on which they are made. We undertake no obligation to update publicly or revise any dated or forward-looking statements. Any references to outside data, opinions or content are listed for informational purposes only and have not been independently verified for accuracy by the Adviser. Third-party views, opinions or forecasts do not necessarily reflect those of the Adviser or its employees. Unless stated otherwise, any mention of specific securities or investments is for illustrative purposes only. Adviser’s clients may or may not hold the securities discussed in their portfolios. Adviser makes no representations that any of the securities discussed have been or will be profitable. Indices are not available for direct investment. Their performance does not reflect the expenses associated with the management of an actual portfolio.