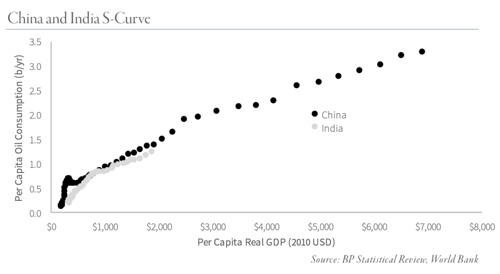
Since 2000, investors in commodities and natural resources have been fixated on China as the main source of demand growth -- for good reason. Over the last 18 years, China’s oil demand has grown by nearly 10 mm b/d, representing 40% of total global demand growth in that period. Chinese total primary energy consumption has grown by 2 bn tonnes of oil equivalent representing over 50% of global growth. We started writing about China back in the early 2000s and built several models that helped us to predict China’s explosive growth very early on. Readers will be familiar with our “S-Curve” models that explore the relationship between real per capita GDP and a country’s oil demand. (For more on S-Curve models, read our Q4 2017 commentary).
Much has been made of the fact that India will never become the “next China,” for a variety of reasons. For example, while China has seen its oil demand grow by 7.7 mm b/d over the last 15 years, Indian demand has only grown by 2.2 mm b/d. Analysts often cite political differences (a particularly bureaucratic democracy vs. a centralized authoritarian regime) as a key factor explaining why India has not mimicked China’s powerful growth. However, our models tell us something very different. While India does indeed face many challenges going forward, the bulk of the shortfall between India and China can be explained by India’s lower level of economic development.
For example, India today is only just reaching the same level of real per capita GDP growth that China reached in 2001, when China first crossed its “S-Curve Tipping Point.” Over the last decade, Indian per capita oil demand has grown by 0.03 barrels per year – the same rate as China between 1991-2001. In 2016, India’s real per capita GDP averaged $1,900 while its oil demand was 1.2 barrels per person per year. These levels are both very similar to China in 2001 when China’s real GDP per capita averaged $1,900 and oil demand was 1.4 barrels per person per year.
(To view chart larger, click on image.)
If India is in fact in the process of crossing its “S-Curve tipping point,” what should we expect to see? If China is any indication, the first clue will be that analysts will begin chronically underestimating Indian oil demand. That is exactly what we see now. Over the last six months, the IEA revised up Indian oil demand going back to 2015 by 235,000 b/d on average and by as much as 370,000 b/d for some quarters. We believe India is now beginning to exhibit accelerating oil demand growth, consistent with a country that has crossed its tipping-point. If India has indeed crossed its tipping-point then, using China as a guide, we should expect to see India grow its per capita oil demand by nearly 2 barrels per person per year over the next 15 years. This equates to 7 mm b/d of total oil demand growth over the decade or ~500,000 mm b/d per year – 67% higher than the IEA estimated in its most recent medium-term energy outlook.
Considering how important we believe India will become to global commodity markets, and in turn commodity investment strategies, we have decided to travel to India at the end of February to conduct an in-depth research project. Over the years, we’ve taken trips to help form our views (particularly about China in the early part of the last decade). In particular, there are significant structural differences between India and China and we will try and explore how they will impact commodity demand growth over the coming decade. We will report our market insights in our next research commentary, but we wanted to provide our readers with a preview of some of the issues the G&R team will be focused on.
To read more of our market insights, download our Q4 2017 commentary.


