
The article below is an excerpt from our Q4 2023 commentary.
The biggest mystery in oil markets surrounds the apparent surge in US production. At the beginning of 2023, we predicted shale growth would slow dramatically. Since 2010, shale oil production has grown by an astounding 8.3 m b/d. Including natural gas liquids, shales added 13 m b/d, representing nearly all non-OPEC growth. The Permian was the main growth driver in recent years, adding 5 m b/d of crude alone. The US shales met more than 100% of global demand growth since 2010.
We argued that while the shales were likely the most prolific source of crude in history, immense was not the same as infinite. We developed sophisticated neural network models to help us understand the ultimate recovery of the various basins and predict when the shales would plateau and eventually roll over. We concluded the immense pick-up in drilling productivity between 2016 and 2018 did not come from improved drilling techniques, as widely advertised, but rather from focusing on the most productive areas of the fields. Instead of turning mediocre acreage into highly profitable wells, the industry was aggressively drilling out the best parts of their resource – a process known in the mining industry as “high-grading.” Such practices cannot go on forever, and we correctly predicted the Eagle Ford and Bakken would begin showing signs of strain in 2019, while the Permian would likely plateau and eventually roll over sometime in either 2024 or 2025. By the start of 2023, our models suggested the Permian would probably see its growth slow dramatically within twelve months and may begin declining as early as the start of 2024.
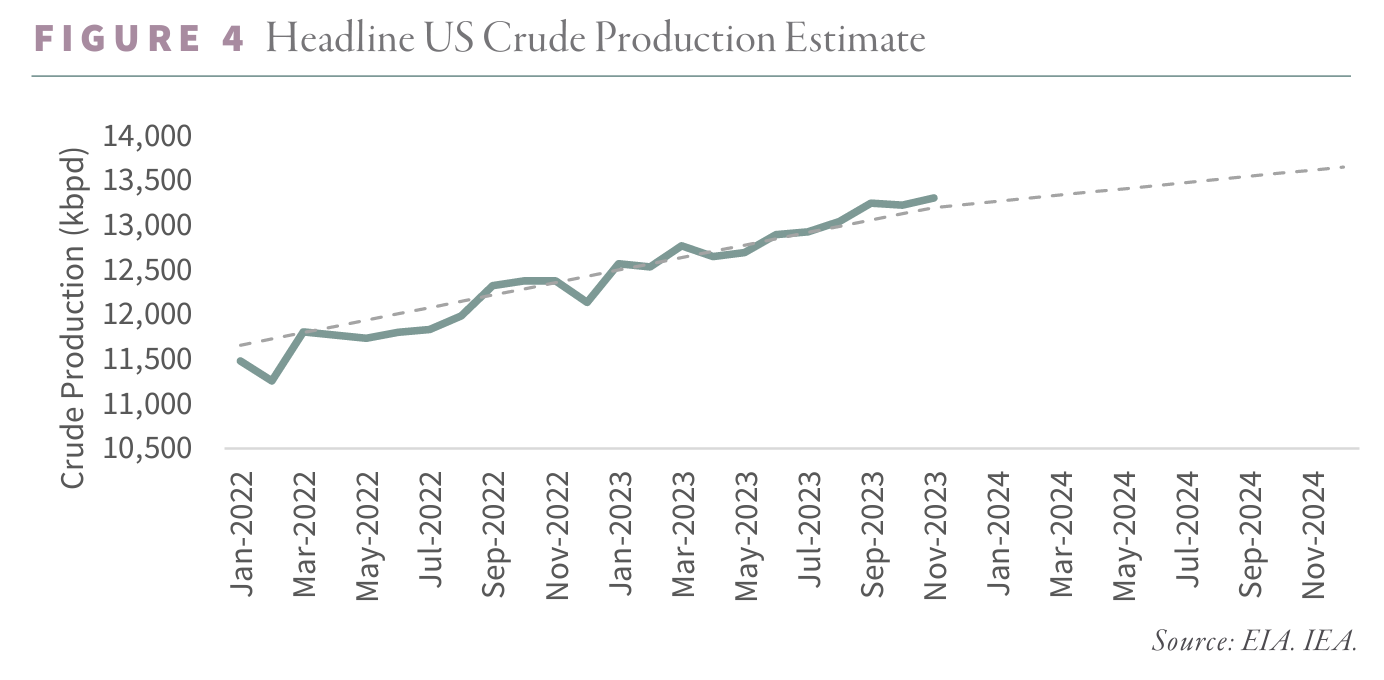
Without the shales, it seemed impossible that US production would continue to grow. From January to December 2022, US crude production rose by a robust 700,000 b/d. We predicted this growth slow dramatically as 2023 progressed. Instead, according to the Energy Information Agency (EIA), US growth accelerated. By November 2023, the last for which we have available data, the EIA claims US crude production was up 930,000 b/d year-on-year, while natural gas liquids added another 600,000 b/d. Taking their cues from the EIA, the International Energy Agency raised its estimates for 2023 US liquids production (including NGLs) by 400,000 b/d, implying year-on-year growth of 1.5 m b/d. According to the figures, 2023 represented the fourth most robust year for liquid growth in US history.
However, as we studied the data more closely, we have strong reason to believe it is simply incorrect. Instead of accelerating growth, our analysis suggests US liquids growth is overstated by nearly 30% while crude growth is overstated by 40%. Most importantly, our analysis tells us growth slowed dramatically throughout 2023 and is at risk of turning negative on both a year-on-year and sequential basis as early as March or April. If we are correct, the implications will be tremendous. Instead of surging, the only material source of non-OPEC production growth is grinding to a halt. Incredibly, we have seen very few analysts comment on the discrepancy, leading us to believe investors are poorly prepared or positioned.
The discrepancy centers around a restatement of government data in the summer of 2023. In March last year, newly appointed EIA Administrator Joesph DeCarolis took to Twitter to discuss the agency’s growing “adjustment factor.” The EIA reports the sources, uses, and inventory changes for crude and petroleum products in the monthly data. While stockpiles are measured directly, production, demand, and net imports are estimated. As a result, each month, the EIA must include an “adjustment factor” that reconciles supply and demand with changes in inventory levels. Between 1981 and 2016, the adjustment factor averaged 140,000 b/d; however, by February 2023, the figure had exploded to 840,000 b/d. Mr. DeCarolis outlined his intention to improve the reporting and “explain” the massive balancing item, which had grown to represent nearly 6% of US crude production.
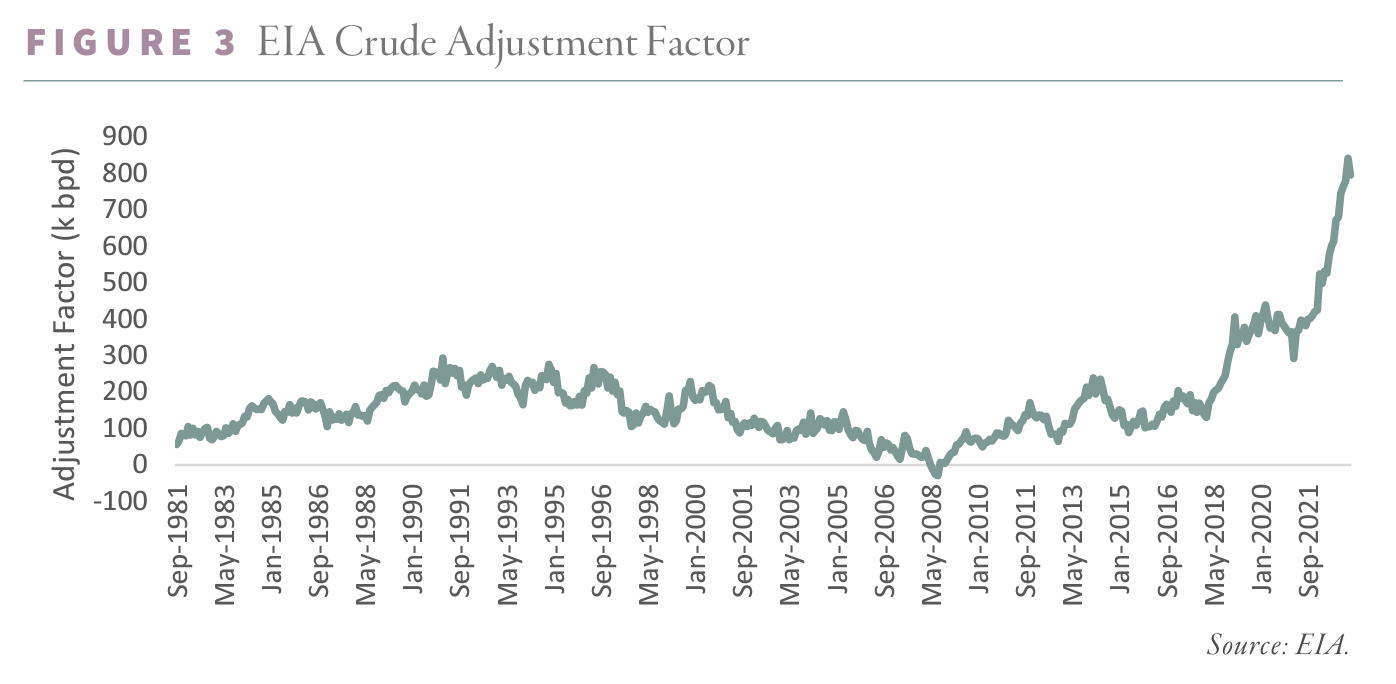
In his tweet, Mr. DeCarolis identified two key culprits. First, field production was being chronically under-reported. Second, operators were capturing and blending a refinery by-product, essentially creating a new unmeasured stream of crude-like liquids that could be fed back into the downstream process.
In July 2023, the EIA began explicitly breaking apart crude blending (“crude transfers”). As a result, the remaining adjustment factor fell by half and began reflecting only the under-reporting of field-level production. On the surface, this may sound bearish. For every month starting in at least January 2022 (the start date of the published revisions), the EIA was likely under-reporting production by 350,000 b/d on average.
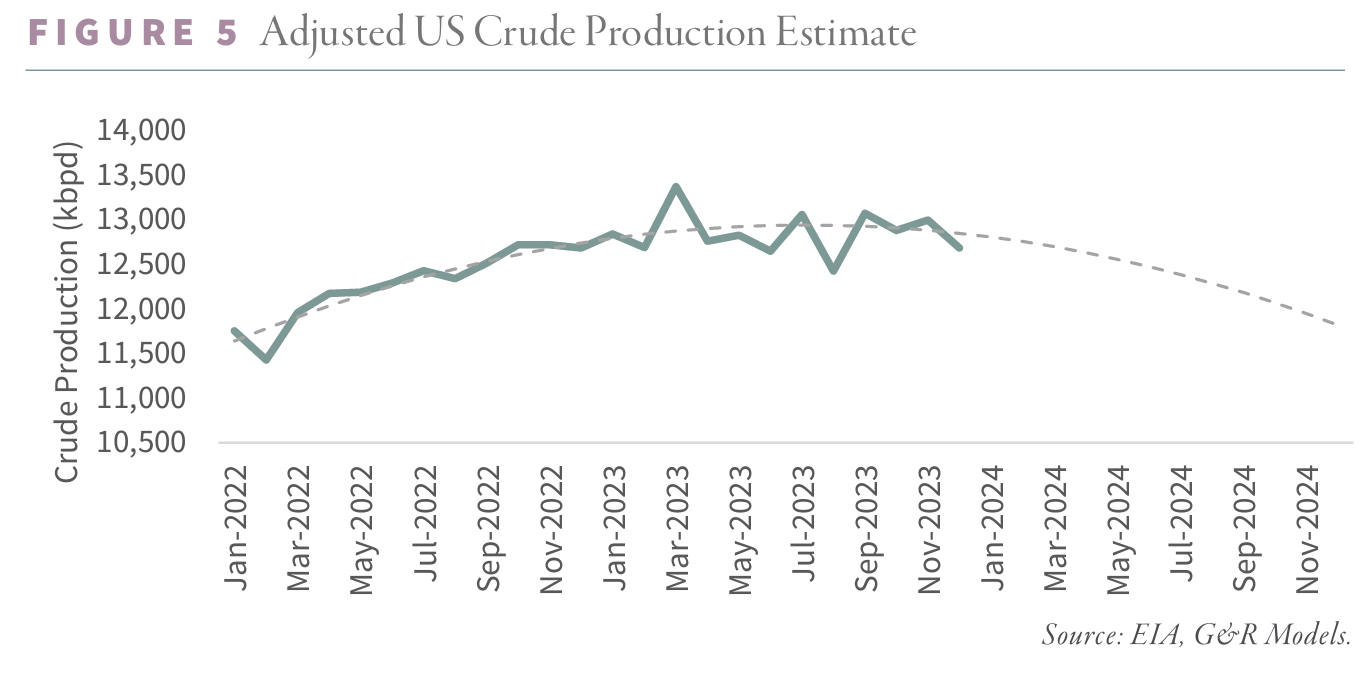
However, upon closer inspection, adding the under-reported crude back to field production changed the growth trajectory entirely. Instead of pumping 11.9 mm b/d in 2022, the US likely produced 12.3 m b/d of oil. In 2023, instead of pumping 12.9 m b/d, the US probably made 12.8 m b/d. In other words, instead of growing by 1 m b/d last year, US crude production growth likely slowed to only 600,000 b/d.
Focusing on the monthly figures paints an even more dire picture. According to the headline figures, year-on-year US crude growth started and ended the year at a healthy 1 m b/d. However, adding back under-reported field production suggests US crude growth started 2023 at 1.4 m b/d and slowed to a mere 311,000 b/d year-on-year by December 2023. In August 2023, the headline figure showed a year-on-year increase of 1.1 m b/d, while the adjusted figure showed a year-on-year decline – the first since COVID-19.
Instead of showing steady and robust growth, our analysis suggests year-on-year US crude production growth will be slowed by 78% throughout 2023 – just as we had predicted last year.
These results are consistent with the other data we study. The total reported shale crude production started in 2023, growing at a healthy 700,000 b/d year-on-year. By December 2023, growth had slowed by 30% to less than 500,000 b/d. Furthermore, most shale growth came from a one-time liquidation of drilled but uncompleted wells in the Bakken. In the Permian – the main growth driver in recent years – crude production growth went from 635,000 b/d year-on-year in January to 100,000 b/d by December – a deceleration of nearly 85%. The US oil-directed rig count fell by 20% throughout 2023, making it highly unlikely US growth could have remained as robust as the headline figures suggest. Most importantly, the slowdown is consistent with our neural network, which tells us that over half of all recoverable reserves have been produced in every major shale basin.
If our analysis is correct, total US crude production may begin to decline sequentially as soon as the second quarter. By the end of 2023, production may be lower by nearly 1 m b/d. US crude production could fall by 470,000 b/d for the entire year compared to 2023. Although NGLs will likely grow, we do not expect it will be enough to offset crude declines. Total US liquids production (including NGLs) could average 19.3 m b/d this year, unchanged from 2023.
Investors have not incorporated the slowdown in their estimates. The IEA expects total US liquids to grow by 800,000 b/d this year – representing the world’s largest single source of growth. If we are correct, other markets will be much tighter than anyone expects within several months.
Over the last twelve months, oil markets have been broadly balanced. OECD commercial inventories drew a modest 100,000 b/d throughout the year. Looking forward, the IEA expects a surplus of nearly 800,000 b/d; however, we disagree. First, we believe the IEA is again underestimating demand, as evidenced by the return of the “missing barrels.” As our readers know, “missing barrels” occur when, according to the IEA, liquids that are neither consumed nor added to inventory are produced. Over the past twenty years, “missing barrels” have often predicted future upward revisions to demand. Last year, the IEA’s missing barrels averaged 400,000 b/d. In the fourth quarter, they reached a very large 700,000 b/d. We believe the IEA is underreporting demand again, especially as we enter 2024. Even if the US shales moderate from 4Q23 levels to an average of 500,000 b/d, the IEA’s expected surplus will fall to only 300,000 b/d.
Moreover, as discussed, the IEA expects US liquids production to grow by 800,000 b/d, whereas our analysis suggests production may be flat in 2024 compared with 2023. If we are even halfway right, oil markets will be in deficit for the fourth consecutive year. Both commercial and government inventories remain below average, leaving markets vulnerable to an unexpected move higher. Speculators hold nearly the lowest level of net-length in twenty years.
We previously predicted privately that if oil markets became tight, governments would release vast quantities from their strategic petroleum reserves to keep prices low. Although we never wrote about our predictions, they were proven correct in 2022 and the first half of 2023. Given the upcoming election, we would not be surprised if the Administration considered releasing further barrels from the SPR – something we would consider a massive mistake. Although this action might depress prices in the near term, we would use further SPR releases to prove the oil market is tighter than expected and exploit the weakness as a buying opportunity.
The only source of non-OPEC growth is grinding to a halt; we believe demand will again surprise the upside in 2024, and inventories, artificially boosted by SPR releases over the last two years, will begin to draw again strongly. Investors will be forced to take notice.
Intrigued? We invite you to download or revisit our entire Q4 2023 research letter, available below.

Registration with the SEC should not be construed as an endorsement or an indicator of investment skill, acumen or experience. Investments in securities are not insured, protected or guaranteed and may result in loss of income and/or principal. Historical performance is not indicative of any specific investment or future results. Investment process, strategies, philosophies, portfolio composition and allocations, security selection criteria and other parameters are current as of the date indicated and are subject to change without prior notice. This communication is distributed for informational purposes, and it is not to be construed as an offer, solicitation, recommendation, or endorsement of any particular security, products, or services. Nothing in this communication is intended to be or should be construed as individualized investment advice. All content is of a general nature and solely for educational, informational and illustrative purposes. This communication may include opinions and forward-looking statements. All statements other than statements of historical fact are opinions and/or forward-looking statements (including words such as “believe,” “estimate,” “anticipate,” “may,” “will,” “should,” and “expect”). Although we believe that the beliefs and expectations reflected in such forward-looking statements are reasonable, we can give no assurance that such beliefs and expectations will prove to be correct. Various factors could cause actual results or performance to differ materially from those discussed in such forward-looking statements. All expressions of opinion are subject to change. You are cautioned not to place undue reliance on these forward-looking statements. Any dated information is published as of its date only. Dated and forward-looking statements speak only as of the date on which they are made. We undertake no obligation to update publicly or revise any dated or forward-looking statements. Any references to outside data, opinions or content are listed for informational purposes only and have not been independently verified for accuracy by the Adviser. Third-party views, opinions or forecasts do not necessarily reflect those of the Adviser or its employees. Unless stated otherwise, any mention of specific securities or investments is for illustrative purposes only. Adviser’s clients may or may not hold the securities discussed in their portfolios. Adviser makes no representations that any of the securities discussed have been or will be profitable. Indices are not available for direct investment. Their performance does not reflect the expenses associated with the management of an actual portfolio.