
The article below is an excerpt from our Q3 2023 commentary.
North American natural gas is the cheapest energy molecule on the planet by as much as 75%. Over the next twelve months, we believe this discount could close entirely, boosting US gas prices as much as four-fold. As we go to print, Henry Hub gas costs $3.00 per mcf while European and Asian gas is $14 and $16.50 respectively. One barrel of oil contains between six and eight mmbtu, so dividing oil by the midpoint of seven generates its energy-equivalent price of $10 per mcf.
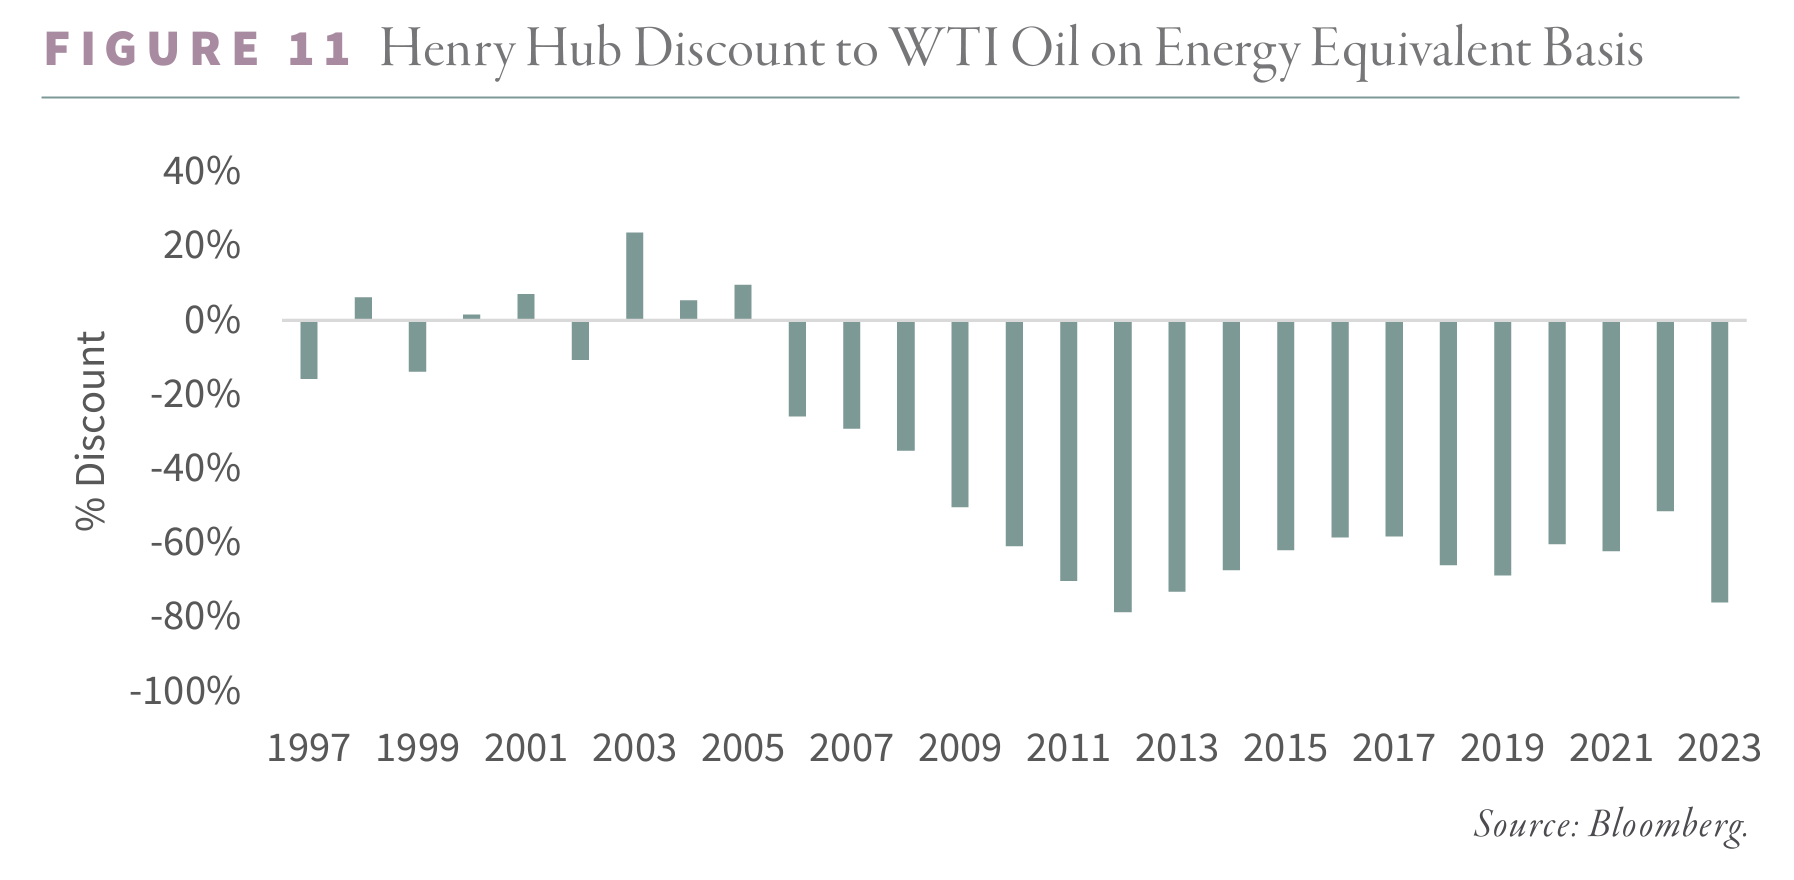
Today’s discount is nothing new; North American gas has traded 60-80% below world prices for nearly a decade with good reason. The shale gas revolution tilted the North American natural gas market in structural surplus. Since 2005, the US gas supply doubled from 54 to 104 bcf/d. Conventional production fell by 56% from 50 to 22 bcf/d, while shale production ramped to over 80 bcf/d – or 80% of total supply. The United States would have faced an acute gas shortage without the shales as conventional natural gas production had declined steeply. Instead, surging shale gas production produced a prolonged (and huge) disconnect to world prices. However, our models tell us that the shales are likely plateauing and the discount to world prices will narrow quickly and most likely disappear.
Cheap US gas has caused demand to surge. Gas-fired electricity generation increased by 127% from 14 to 33 bcf/d, while industrial use increased by 20% or three bcf/d. Most notably, the United States went from being one of the world’s largest gas net importer, at two bcf/d per day, to the largest net exporter, at 12 bcf/d per day – a swing of 14 bcf/d. Despite the surge in new demand, shale supply continued to outpace consumption and the market remained stuck in a structural surplus. Between 2005 and 2023, rolling twelve-month US natural gas inventories (to adjust for seasonality) increased by 50% from 2 tcf to 3 tcf.
Given such strong demand, if shale production ever faltered, the discount between US and world prices would close quickly, what we call convergence. Our models suggest the North American gas market will switch from structural surplus to structural deficit in six months. The results would be profound. The US consumes 90 bcf/d domestically; a move from $3 to $10-12 would cost US industry and consumers a combined $350 bn, or 1% of GDP.
We first outlined our convergence thesis in late 2021. However, an extremely warm winter in the United States and Europe and a fire that rendered the Freeport LNG export facility inoperative pushed the trade out by a year. We argued that the Marcellus, Haynesville, and associated gas from the Permian were all set to plateau and roll over. These three basins accounted for an incredible 58 bcf/d of growth since 2005; US production would have declined without them. However, despite their vast size and robust growth, they are not immune from the geological realities of depletion and field exhaustion. Immense is not the same as infinite, we like to say, and eventually, their production will decline.
The first two shale gas plays to be developed, the Barnett in Texas and Fayetteville in Arkansas, caught everyone off guard when their growth slowed, flattened, and rolled over. In December 2009, Exxon agreed to buy XTO Energy, a premiere Barnett producer, for nearly $40 bn. Before the recent announcement to purchase Pioneer Natural Resources, XTO was Exxon’s most significant transaction since buying Mobil in 1999. Exxon paid four times XTO’s PV-10 value plus debt, suggesting Exxon felt they could markedly grow reserves and production in the Barnett. Instead, Barnett production rolled over twenty months later, and today, it stands 65% below its November 2011 peak. Exxon has now written off half the value of its XTO purchase price.
What lessons can be learned from the Barnett and Fayetteville? We used our shale neural network to uncover hidden indicators, suggesting when production might plateau and decline. The neural network estimates the ultimate recovery of a well given the subsurface geology and well design. By tallying what had been produced and what remained to be developed, we evaluated the recovery for the entire basin. We estimated that Barnett and Fayetteville had reserves of 23 and 10 tcf, respectively. Notably, production in both fields plateaued once half their reserves had been produced – twelve tcf for the Barnett and five tcf for the Fayetteville.
The neural network predicts the Marcellus will eventually produce 135 tcf – one of the largest gas fields in history. The field has made 79 tcf to date, or nearly 60%. According to our models, Marcellus produced 50% of its recoverable reserves in May 2022; on schedule, production flattened. From December 2021 to June 2023, Marcellus dry gas production declined by nearly one bcf/d – the first time the field fell over eighteen months. Although preliminary data indicates a slight recovery in July and August, we believe it will prove temporary. While some analysts believe the pause in Marcellus growth is a function of pipeline bottlenecks, we disagree. If it were an infrastructure issue, we would not expect any impact on productivity. If top-tier drilling inventory depletion were to blame, productivity would fall. According to the EIA, per-well productivity in the Marcellus has slowed dramatically since peaking in 2021, which is confirmed by what our neural network tells us. We strongly believe top-tier drilling inventory depletion is the culprit.
Our neural network predicts that Haynesville will recover 73 tcf, of which 36 tcf, or 50%, have been produced. The field has exhibited strong growth in recent years, but we believe this will now moderate going forward. In fact, over the short term, declines are almost guaranteed. The basin is deep and highly over-pressured, meaning wells are expensive to drill and complete. As prices pulled back, producers curtailed development, laying down 40% of the rigs in the basin this year. With 45 rigs turning today, production is almost sure to fall. Most analysts believe growth will resume once prices advance. Our neural network tells us that 2022-2023 will be the production peak for the field.
Meanwhile, the Permian basin is suffering depletion problems of its own. We discuss the field in greater depth in the Oil section, but in summary, we do not expect it to be a significant growth driver in the future.
Supply issues are now in place and enough for convergence to occur. However, demand factors make convergence a near certainty in 2024. Six additional bcf/d of LNG export capacity are scheduled for operation in late 2024 and 2025. After years of surging supply, few are worried about where the gas will be sourced. Our models tell us that there is no way production can grow to meet this additional export demand. Driven by supply and demand trends, North American natural gas is about to enter a structural deficit for the first time in 20 years.
If we are right, we would not be surprised if President Biden issued an executive order limiting exports to lower the natural gas price. If exports were limited, it would have a knock-on effect on Europe, which has come to rely on safe, secure US LNG to offset lost Russian volumes.
North American inventories have repaired much of the surplus accumulated after winter’s mild weather. Stocks peaked at 300 bcf above ten-year averages in May and have been declining since, presently standing at only 100 bcf above average. Unfortunately, weather is always a wild card with natural gas. Another mild winter will forestall (but not prevent) convergence. If weather is seasonable, we expect inventories will end the withdrawal season in a mild deficit to seasonal averages, making it very difficult to replenish stocks to a level that can accommodate the new LNG demand.
Natural gas equities have some of the best return potential in the resources universe. Range Resources – our most significant gas holding – trades at $33. Its debt-adjusted SEC PV-10 per share from the 2022 10-K is $94 – or three times the stock price. Critics will argue that last year’s 10-K reflected $6 gas – twice today’s price. This is true; however, using the depressed spot prices, Range still represents a modest upside. If natural gas converged with world prices, and Range was able to realize $10 per mcf, its PV-10 would be $182 – five times today’s stock price.
We have been early with our convergence call; however, we are confident that convergence will occur in 2024. Most fundamentals, including stagnating Marcellus production and Haynesville production, have progressed exactly as we predicted. Our timing error was mainly due to last winter’s mild temperatures. Investors are getting a second opportunity to put this trade on—we believe the rewards versus the risks are hugely positive.
Intrigued? We invite you to download or revisit our entire Q3 2023 research letter, available below.

Registration with the SEC should not be construed as an endorsement or an indicator of investment skill, acumen or experience. Investments in securities are not insured, protected or guaranteed and may result in loss of income and/or principal. Historical performance is not indicative of any specific investment or future results. Investment process, strategies, philosophies, portfolio composition and allocations, security selection criteria and other parameters are current as of the date indicated and are subject to change without prior notice. This communication is distributed for informational purposes, and it is not to be construed as an offer, solicitation, recommendation, or endorsement of any particular security, products, or services. Nothing in this communication is intended to be or should be construed as individualized investment advice. All content is of a general nature and solely for educational, informational and illustrative purposes. This communication may include opinions and forward-looking statements. All statements other than statements of historical fact are opinions and/or forward-looking statements (including words such as “believe,” “estimate,” “anticipate,” “may,” “will,” “should,” and “expect”). Although we believe that the beliefs and expectations reflected in such forward-looking statements are reasonable, we can give no assurance that such beliefs and expectations will prove to be correct. Various factors could cause actual results or performance to differ materially from those discussed in such forward-looking statements. All expressions of opinion are subject to change. You are cautioned not to place undue reliance on these forward-looking statements. Any dated information is published as of its date only. Dated and forward-looking statements speak only as of the date on which they are made. We undertake no obligation to update publicly or revise any dated or forward-looking statements. Any references to outside data, opinions or content are listed for informational purposes only and have not been independently verified for accuracy by the Adviser. Third-party views, opinions or forecasts do not necessarily reflect those of the Adviser or its employees. Unless stated otherwise, any mention of specific securities or investments is for illustrative purposes only. Adviser’s clients may or may not hold the securities discussed in their portfolios. Adviser makes no representations that any of the securities discussed have been or will be profitable. Indices are not available for direct investment. Their performance does not reflect the expenses associated with the management of an actual portfolio.