
The article below is an excerpt from our Q2 2025 commentary.
In the second quarter, the commodity complex split neatly into two camps. On one side: uranium, platinum group metals, and gold—stubbornly immune to the malaise that swept through nearly everything else. On the other: a broad swath of resources quietly losing altitude, their decline accelerated by President Trump’s April 2nd Inauguration Day tariff announcements, which injected a level of uncertainty into global commodity markets not seen in years.
The numbers told the story in quick strokes. The energy-heavy Goldman Sachs Commodity Spot Index slid 4.5%; the Rogers International Commodity Index, with its heavier tilt toward metals and agriculture, fell 3.1%. Resource equities were a study in contrasts. In North America, the S&P Natural Resource Sector Index—weighted toward energy—dropped 2.1%. Globally, the S&P Natural Resource Index, buoyed by metals and agriculture, gained 3.3%.
Beyond the resource world, equity markets roared back from their first-quarter slump. Investors, emboldened or perhaps forgetful, poured back into last decade’s anointed winners— the mega-cap technology names. The S&P 500 surged 11%. The NASDAQ 100, driven by its tech leviathans, soared an eye-catching 18%. In the process, the tech trade more than erased its early-year weakness and reclaimed center stage.
Yet amid the tariff-induced jitters, a few commodities refused to play along. Uranium, platinum group metals, gold, and silver all rose smartly, as if oblivious to Washington’s noise. Their strength wasn’t just a counterpoint to the general drift lower—it was a reminder that in commodity markets, the bigger story often runs on its own timetable.
Uranium
In our last letter, we suggested—quietly but with conviction—that uranium might be setting the stage for an old-fashioned short squeeze. The setup was there: hedge funds, brimming with certainty, had built large short positions in uranium equities. Their reasoning, we thought, was as shaky as a prospector’s ladder. The Sprott Physical Uranium Trust, they argued, was about to run out of cash and would be forced to dump part of its uranium stockpile into the market—sending prices down in a tidy cascade.
It didn’t happen.
Instead, in the second quarter, the Trust raised fresh cash with the ease of a seasoned hand passing the hat in a friendly crowd. The bearish script tore in the middle. Hedge funds, caught with the wrong end of the bet, scrambled to cover. The spot uranium price climbed 15%, but the real fireworks were in the equities: the URNM uranium ETF surged 45%, the best performance in the entire commodity complex.
This was not simply a short-term skirmish. The nuclear power story is no longer about possibility; it’s about arrival. Announcements keep coming—new reactors, new fuel demand, new commitments—and each one tightens the long-term supply picture. In an op-ed we’ve written elsewhere, we make the case that the molten-salt reactor, once an engineer’s daydream, could emerge as a real-world solution to the fiscal dilemmas of debt-heavy Western economies.
The first leg of this bull market in uranium is behind us. Prices have already risen nearly fivefold in four years. Now, with the air clearer and the bears scattered, we believe the second leg—stronger, faster, and more decisive—has begun.
Platinum Group Metals
Platinum and palladium, two metals accustomed to long stretches of market neglect, staged a sharp reversal this quarter. Platinum prices jumped 37%, palladium gained 12%, and the three major South African producers—long battered by a dismal market—rose an average of nearly 40%.
It is not a rally born of whim. For years, both metals have been grinding through deep bear markets, prices depressed by demand weakness and the slow bleed of above-ground stocks. In our last letter, we argued that those stocks were dwindling, the deficits were deeper than advertised, and the day would come when supply would no longer mask scarcity. When that happened, the price moves would be abrupt.
That day, we think, has arrived.
In the PGM Section of this letter, we lay out the second-quarter trends that strengthen our conviction: supply pipelines tightening, demand sources holding firm, and inventories drawing down with each passing month. These bear markets have been living on borrowed time, and the clock has run out. A new bull market in platinum group metals is underway.
Gold and Silver
Gold spent the quarter behaving like a market that couldn’t quite decide whether it was in trouble or in charge. In the wake of President Trump’s “Inauguration Day” tariff announcement, prices dropped 5% almost overnight. Two weeks later, they had rallied 15%—a snapback fueled less by optimism than by the dawning realization that Trump’s trade policy had injected a new strain into global finance. It was an unusual strain: both U.S. Treasury bonds and the dollar fell together, a pairing that almost always signals systemic stress.
From there, the metal made its move. Gold set three consecutive all-time highs in the quarter, topping out at $3,432 on June 13. It finished the quarter up 5%—a modest number that conceals the magnitude of the swings in between. Silver followed its own, quieter arc, ending the quarter ahead by just over 4%.
The equities told a more uniform story. The GDX gold stock ETF climbed 13.3%, and the SIL silver stock ETF rose 22%. Yet, for all this strength, the public has been conspicuously absent. In fact, gold and gold equities have been the best-performing asset class over the past eighteen months, and investor interest has declined.
Why that matters—and why it reminds us of the run-up to the 2011 peak in reverse—is a topic we explore in detail in the Gold and Silver section of this letter. If our reading is correct, this kind of broad disinterest, when set against strong prices, is not apathy at all. It is a bullish signal hiding in plain sight.
Oil
“BP Says Oil Supply Growth Outside OPEC to Stall Next Year”
– Bloomberg News, August 8, 2025.
In the second quarter, the energy complex led the commodity markets lower. Oil prices— WTI and Brent alike—reacted to President Trump’s April 2nd tariff announcements with a sharp pullback, only to stage a spirited June rally that erased the losses, then give it all back again. The quarter ended with crude down 9%, and the mood in the oil pits distinctly sour.
The International Energy Agency did its part to deepen the gloom. Its June Oil 2025 report offered a forecast so downbeat it bordered on funereal: oil demand, it claimed, would barely grow over the next five years, while world liquids capacity—oil and natural gas liquids together—would swell by nearly 7.5 million barrels per day, tipping the market into a structural surplus of historic proportions.
Investors took the cue. Energy’s weighting in the S&P 500 slid back under 3%, a level last seen in the depths of the COVID panic. By another measure—the gold-to-oil ratio—oil now sits at one of the cheapest points in history. In April, an ounce of gold bought 58 barrels of crude, a reading matched only once before, in April 2020 at the height of lockdowns.
For anyone with a memory longer than a news cycle, the symmetry is striking. In the late 1990s and early 2000s, it was gold, not oil, that had been declared obsolete. European central banks raced to dump their reserves; gold bears pronounced the metal “demonetized.” Between 1999 and 2005, the gold-to-oil ratio repeatedly fell below 10, touching lows of 6.8 in August 1999 and 7.3 in September 2000 when gold fetched $270 and oil $37. Investors willing to believe those prices were wrong found themselves buying the trade of a generation: from the summer of 2000 to the fall of 2011, gold rose sevenfold, gold stocks fifteenfold.
The message of today’s ratio is just as clear—if you’re willing to hear it. Oil, in gold terms, is as cheap as it has ever been. The bearish narrative behind that cheapness—that electric vehicles will hollow out oil demand, that non-OPEC supply will grow relentlessly—has the same hollow ring as the “gold is dead” chorus of 2000.
We believe both pillars of the IEA’s outlook will fail. EV adoption, the linchpin of its demand pessimism, is already showing cracks. And its supply optimism leans heavily on a U.S. shale boom that has quietly plateaued and, by our analysis, is poised to decline—a reality the IEA has yet to factor in.
The last time the gold-to-oil ratio was this extreme, it marked the start of an eleven-year run in which the maligned asset – at that time gold -- trounced every other class. We think history is about to rhyme. Oil’s turn is next. For the supporting data—on both the demand resilience and the looming supply constraints—see the Oil section that follows.
Natural Gas
“US Will Need to Ramp up LNG Output for Trade Deals.”
– Bloomberg Energy, August 5, 2025
Natural gas spent the second quarter in retreat, at home and abroad. In North America, Henry Hub prices slid 16%; Canadian gas collapsed by 60%. Overseas, the picture was mixed: in Asia, strong demand kept prices almost flat, down just 1.5%, while in Europe, a warm early spring sent prices tumbling more than 20%.
In the U.S., the story could be told in two acts, both weather-driven. Act one began last winter. As the withdrawal season opened, inventories sat roughly 340 billion cubic feet above their ten-year average—about 10% too high. Then January and February defied recent patterns, running 10% colder than normal. Demand spiked, furnaces roared, and in just two months the surplus vanished, replaced by a 70 bcf deficit. Prices responded with equal swiftness: by mid-March, Henry Hub had risen 25%.
Act two reversed the plot. March turned 8% warmer than normal, spring cooling demand lagged, and the summer cooling season was slow to start. May and June together delivered 8% fewer cooling degree days than average. By the end of June, inventories had swollen again—this time 350 bcf above normal—and prices gave back their gains, falling nearly 20% in the quarter.
Canada followed the same script, only more sharply. Its inventories swung just as violently, but the smaller market amplified every weather-driven move. The result was a second-quarter collapse far steeper than in the U.S.—a reminder that in natural gas, the line between shortage and glut is often just a few degrees on the thermometer.
For now, the market prefers to see the glass half empty. Inventories are back above seasonal norms, the speculative crowd has resumed its bearish stance, and the price boards in North America seem to confirm their pessimism. Yet the underlying fundamentals—stubborn, structural, and global—still point the other way.
Look overseas. In Asia, spot LNG trades at $11.50 per mmbtu. In Europe, it’s above $10. Compare that to sub-$3 prices in the U.S. and an almost absurd $0.60 in Canada. Measured by the heat content alone, American gas sells at roughly a 70% discount to world prices; Canadian gas at a 90% discount. A BTU, it turns out, is not worth the same everywhere— at least not yet.
Production trends are not what the headline numbers suggest. The EIA’s July 2025 ShortTerm Energy Outlook shows shale gas output essentially flat since December 2023. But in its 914 report, which measures total U.S. dry gas production, the agency reports an increase of 1.7 bcf per day over that same stretch. The gap shows up in the “balancing item” —the catch-all that reconciles the two series—and it raises a question we will explore in the Natural Gas section: is the EIA overstating total U.S. production?
Our own work points to supply losing steam. U.S. gas output, by our estimates, is decelerating rapidly. Against that, add 6 bcf per day of new LNG export capacity scheduled to come online within a year, and the balance tips sharply. Inventories that today feel comfortable could be drawn down faster than expected, and the yawning gap between North American and international prices could begin to close. If it does, it will not be in inches but in leaps.
Agriculture
Grain prices spent the second quarter sliding sideways to down, even as their upstream inputs told a very different story. Corn slipped nearly 5% on the back of near-perfect spring planting weather in the U.S. Midwest; soybeans stood still; wheat gave up 1%. Meanwhile, the raw materials that make those crops possible—fertilizers—moved in the opposite direction. Urea, the solid form of nitrogen, rose 13%; phosphates gained 17%; potash climbed 7%.
That divergence has now stretched across the year. Corn, wheat, and soybeans are all flat to down year-to-date. Fertilizers are not. Urea and phosphates are each up roughly 25%; potash has advanced more than 30%. This is not random noise. When the cost of growing food rises while the price of the food itself drifts, one of two things usually happens: either the farmers’ margins collapse, or grain prices catch up.
Our view, laid out in past letters, is that last summer marked the bottom in agricultural markets. The next leg—quiet for now—has already begun. Fertilizer strength in the face of lackluster grain prices is not a contradiction; it is an early warning. The inputs are already in a bull market. The outputs will follow.
Base Metals
Base metals drifted in different directions through the second quarter. Copper went nowhere; aluminum managed a 2.6% rise; zinc and nickel slipped 3.4% and 4.4%. Equities told a different story: the COPX copper ETF surged 16%, while the XBM CN base metals ETF, a proxy for the S&P Global Base Metals Index, gained 7%.
Then, just after the quarter closed, copper took the stage for a performance in three acts.
Act One came on July 8, when President Trump announced a 50% tariff on all copper imports into the United States. COMEX futures in New York leapt almost 15% in days, pushing U.S. copper to an all-time high of $5.85 per pound. London Metal Exchange (LME) prices barely stirred, and the spread between the two markets blew out to $1.30 per pound as traders scrambled to get copper in before the July 30 deadline.
Act Two came without warning. On July 30—just one day before the tariffs were set to bite—the White House reversed course: the 50% levy would apply only to semi-finished copper, leaving refined metal untouched. The market did what markets do when the premise of a trade disappears—it collapsed. COMEX prices fell almost 30% in a matter of days.
Act Three is still playing out. Today, copper sits roughly 10% below where it began the quarter. The once-yawning gap between COMEX and LME prices has vanished, and for now, both markets have returned to something like normal. The long-term consequences of the tariff ’s narrower scope remain uncertain. For the moment, it feels less like a lasting shift in the copper trade than a particularly violent squall in a summer market.
In last quarter’s letter, we noted an oddity in the copper market that had been gnawing at the numbers: the World Bureau of Metal Statistics (WBMS) had quietly redrawn the map of Chinese demand.
As recently as the third quarter of last year, WBMS still projected that China’s 2024 copper consumption would grow 2.5% over 2023—a perfectly respectable figure, especially following the prior year’s head-turning 13% surge. Then, somewhere between autumn and the first quarter of 2025, the weather changed. WBMS didn’t just trim the estimate; they took an axe to it. That 2.5% growth forecast became a 10% contraction.
For us, the implications were immediate. Our own model of global copper consumption— which had pointed to a 2.5% rise for 2024—flipped into a 4% decline. More importantly, it offered a tidy explanation for one of the market’s nagging puzzles: the sudden surge in exchange-held inventories. COMEX, LME, and Shanghai warehouses—all repositories of copper that can be mobilized at a moment’s notice—had been filling since early 2024. The downward revision in Chinese demand turned what had looked like a mystery into something much simpler: the copper wasn’t disappearing because it was scarce. It was piling up because a major buyer had quietly stepped back.
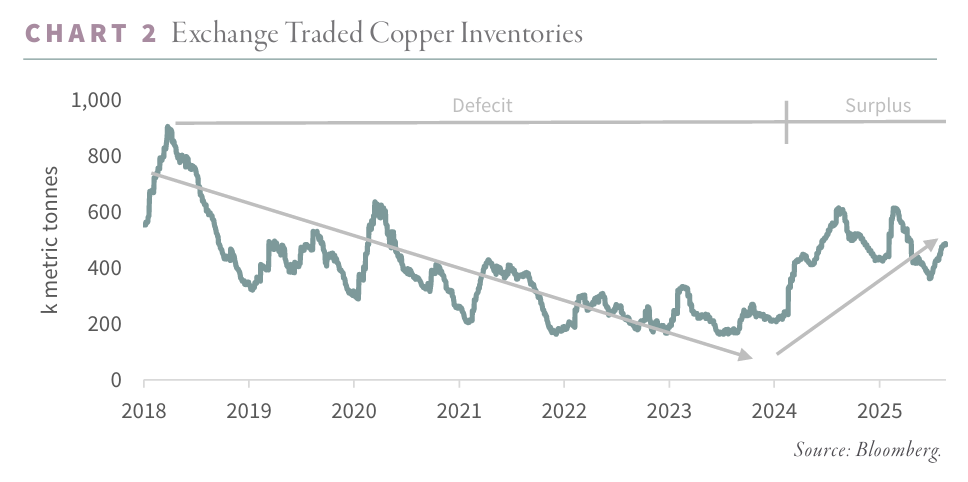
Since our last letter, the World Bureau of Metal Statistics has performed something rare in commodity data—a public rewrite of history. Just three months ago, WBMS figures showed China’s 2023 copper consumption surging 12% over 2022. In their latest release, that growth has vanished. The revision—down by a staggering 1.7 million tonnes—leaves China’s 2023 usage essentially flat, with no change to the 2022 baseline.
The global implications were immediate. Last year’s world copper demand, which WBMS had pegged at 7% growth, is now whittled to almost nothing. On paper, the robust 2023 market deficit we calculated—one that helped explain the drawdown in exchange inventories—has been erased. The new numbers turn what we thought were deficits in both 2023 and 2024 into surpluses.
And yet, the warehouse floors tell a different story. While 2024’s exchange inventories do suggest a structural surplus, the inventory changes in 2023 don’t fully square with the WBMS’s revised history. That leaves the market in a peculiar position: if 2023 wasn’t as strong as first reported, was it really as weak as now claimed? In our third-quarter letter, we will dig into current supply-and-demand balances—and how that already difficult question is being muddied further by President Trump’s erratic copper tariff policies.
Coal
“A resurgence in construction of new coal-fired power plants in China is “undermining the country’s clean-energy progress," says a new joint report by the Centre for Research on Energy, and the Global Energy Monitor - February 13, 2025
The second quarter itself was quieter. U.S. prices for Powder River Basin, Central Appalachia, and Illinois Basin coal each crept up about 1%. Overseas, the story was more lively. Seaborne thermal prices, still smarting from steep first-quarter losses, found footing in weather. A burst of hot-season demand from China lifted Newcastle thermal coal by 10% and Richards Bay by 5%. Metallurgical coal, however, faced the opposite pull—sliding 5% on fears of steelmaking capacity cuts in China.
The equity market noticed the shift in tone. Coal stocks, tracking the firmer seaborne trade, rebounded sharply: the Dow Jones Wilshire U.S. Coal Index gained 25% for the quarter. It was not a boom, but it was the kind of move that suggested traders were beginning to question whether the “post-coal” narrative was quite as close at hand as they had been told.
Global coal markets—and the handful of coal stocks still left on the public stage, trading at valuations so low they look like typos—are gripped by the same question that has animated energy debates for a decade: has the world already seen its last year of coal demand growth? The International Energy Agency thinks so, or close to it. In its Coal Mid-Year Update 2025, the agency suggested that 2024’s 1.5% increase might prove to be the high-water mark. The forecast for 2025 and 2026: growth barely visible, with India adding about 2.5% but China— by far the largest consumer—flatlining.
The reasoning hinges on renewables. The IEA argues that China’s massive wind and solar build-out has finally reached a “critical mass” able to bite into coal-fired generation in a durable way. For years, energy-transition consultants, market analysts, and idealistic investors have waited for exactly this moment: the day when China’s renewable capacity became large enough to force coal into retreat.
The last six months seemed to feed that hope. Coal-fired electricity output in China dipped, and the drop was read—perhaps too eagerly—as a structural shift. But the newer data offer a less idealistic reading. The decline, it turns out, lines up neatly with a warm winter and a slowing economy, rather than any sweeping victory for wind and solar. And if there were still doubts about Beijing’s intentions, recent policy has removed them. Far from capping coal capacity, China has been green-lighting new coal plants at a pace that makes its “transition” sound more like an addition.
For readers who want a deeper look at coal’s entrenchment in China’s power sector, a short report from the Centre for Research on Energy and Clean Air (CREA), published in the first quarter of 2025, is worth the time. CREA’s conclusion runs close to our own. Despite a record-breaking build-out of renewables, China’s investment in coal-fired capacity continues at full tilt.
As the report puts it:
“This record-breaking expansion [of renewables] highlights China’s leadership in clean energy. Yet instead of replacing coal, clean energy is being layered on top of an entrenched reliance on fossil fuels. This reality makes it increasingly difficult to achieve the principle of ‘establish before breaking’—scaling up clean energy before gradually phasing down fossil fuels. Although renewables have been deployed at an unprecedented pace, coal power has remained firmly in place, often limiting renewables’ integration and full utilization. As a result, China’s energy strategy increasingly resembles ‘energy addition’ rather than a fundamental shift away from coal.”
The numbers back it up. While 2024 permitting trends pointed modestly downward, the year still saw more coal-fired plant construction starts than any year since 2015. In CREA’s telling, this is not a transition—it is an expansion with better branding.
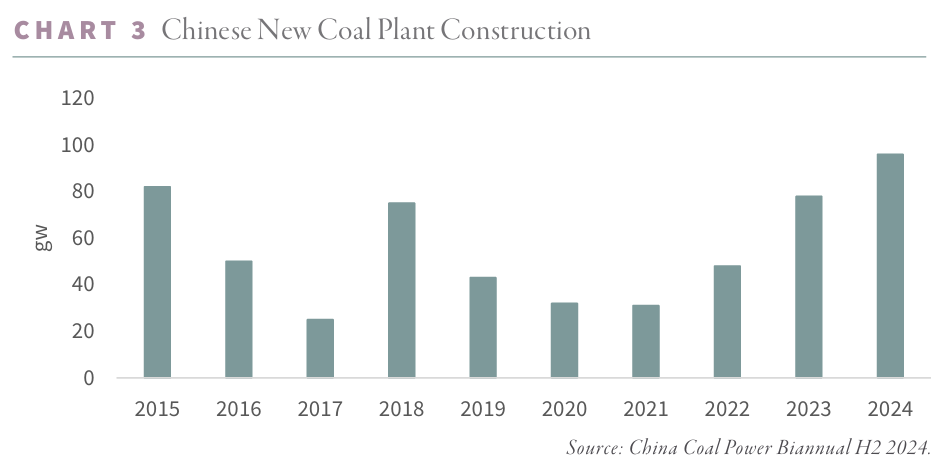
Permitting has slowed from the frenzy of 2023 but remains far from restraint. In 2024, approvals dipped from the prior year’s highs — yet the pace still comfortably outstripped planned retirements. The first quarter of 2025 brought 11.3 gigawatts of new capacity onto the books, essentially matching 2024’s clip. In other words, the conveyor belt is still moving, and it’s loading more coal than it unloads.
And if there were any doubt about Beijing’s intentions, Bloomberg dispelled it on July 28. In a report titled “China’s Coal Pipeline Risks Creating Glut, Blowing Climate Goals,” the news service noted that every watt from China’s new coal plants will be fed by coal from new mines. The proposal calls for 450 of them, scattered across the provinces, with a combined capacity of 1.35 billion tons a year — nearly a 30% boost to China’s coal supply. If fully built, those mines alone would produce more coal than Indonesia and Australia combined. It is a blueprint for expansion, not contraction, and it tells you more about China’s long-term energy strategy than any climate pledge could.
The IEA still clings to its vision of a Chinese coal peak — a moment when renewables finally eat into the country’s vast coal appetite. But Beijing’s own moves now stand as the strongest rebuttal. The permitting of new coal-fired generation continues at a pace that, while lower than last year, still dwarfs retirements. Layer on the July 28 Bloomberg revelation — 450 new coal mines, 1.35 billion tons of annual capacity — and the pattern becomes unmistakable: China is not preparing to have coal displaced by renewables; it is preparing to have more coal, and the supply chain to match. CREA’s blunt conclusion seems the only one that fits the facts: renewables will supplement China’s coal-fired base, not supplant it. And with China accounting for 56% of the world’s consumption, the global question of “peak coal” will be answered in Beijing, not Brussels. T he latest surge in plant construction and production plans points to a clear answer: not this decade. For investors, coal has been left to the bargain bin — the few remaining public names priced as if the industry’s obituary were already written. But for those willing to be unfashionable, the fundamentals still whisper the same thing they did before the last great rally: there is value here, hiding in plain sight.
Curious to learn more now? Read more in our Q2 2025 research newsletter, available for download below.
Registration with the SEC should not be construed as an endorsement or an indicator of investment skill, acumen or experience. Investments in securities are not insured, protected or guaranteed and may result in loss of income and/or principal. Historical performance is not indicative of any specific investment or future results. Investment process, strategies, philosophies, portfolio composition and allocations, security selection criteria and other parameters are current as of the date indicated and are subject to change without prior notice. This communication is distributed for informational purposes, and it is not to be construed as an offer, solicitation, recommendation, or endorsement of any particular security, products, or services. Nothing in this communication is intended to be or should be construed as individualized investment advice. All content is of a general nature and solely for educational, informational and illustrative purposes. This communication may include opinions and forward-looking statements. All statements other than statements of historical fact are opinions and/or forward-looking statements (including words such as “believe,” “estimate,” “anticipate,” “may,” “will,” “should,” and “expect”). Although we believe that the beliefs and expectations reflected in such forward-looking statements are reasonable, we can give no assurance that such beliefs and expectations will prove to be correct. Various factors could cause actual results or performance to differ materially from those discussed in such forward-looking statements. All expressions of opinion are subject to change. You are cautioned not to place undue reliance on these forward-looking statements. Any dated information is published as of its date only. Dated and forward-looking statements speak only as of the date on which they are made. We undertake no obligation to update publicly or revise any dated or forward-looking statements. Any references to outside data, opinions or content are listed for informational purposes only and have not been independently verified for accuracy by the Adviser. Third-party views, opinions or forecasts do not necessarily reflect those of the Adviser or its employees. Unless stated otherwise, any mention of specific securities or investments is for illustrative purposes only. Adviser’s clients may or may not hold the securities discussed in their portfolios. Adviser makes no representations that any of the securities discussed have been or will be profitable. Indices are not available for direct investment. Their performance does not reflect the expenses associated with the management of an actual portfolio.