
The article below is an excerpt from our Q4 2023 commentary.
Copper demand was extremely strong in 2023, growing 7.3% year-on-year over the first ten months, according to the World Bureau of Metal Statistics (WBMS).
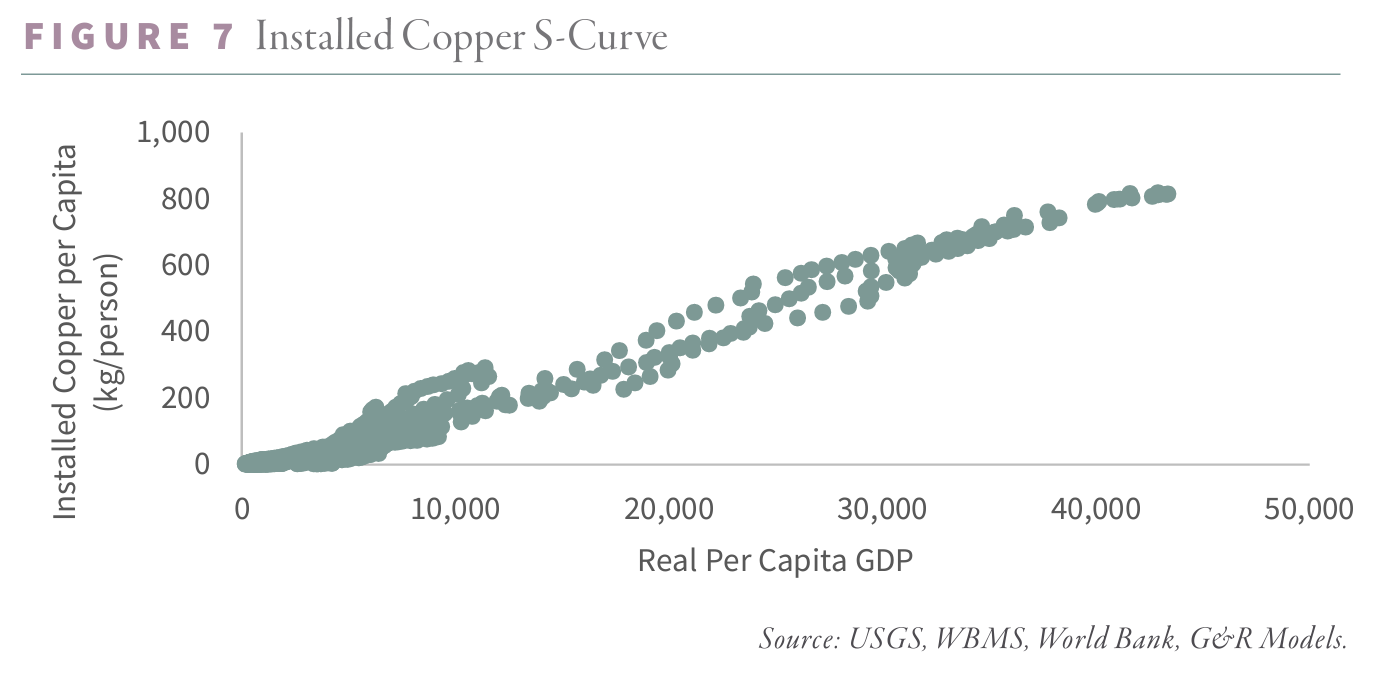
Nearly all copper demand growth came from the non-OECD world. As in recent years, China led the group higher. Although many remain concerned about perceived weak Chinese economic output and ongoing problems in their property sector, Dr. Copper is undeterred. Countless analysts have warned for years that China is over-consuming copper, but we disagree. These analysts often model annual copper demand as a function of real GDP, which we believe is a mistake. Unlike oil, which economies consume, copper is “installed.” Like any capital good, “installed copper” will last decades. Instead of looking at annual copper consumption (a flow, for those accountants among you), we prefer to analyze an economy’s total installed copper base, net of a depreciation allowance (a stock). By studying the relationship between its cumulative installed copper base and real GDP, we concluded that China is exactly where it should be for an economy of its size. Sporting a real per capita GDP of $12,500, China has approximately 260 pounds of installed copper for every man, woman, and child. As you can see from the chart below, China’s installed copper base is very much in line with other countries at similar levels of economic development.
Chinese officials have repeatedly expressed a desire to avoid the dreaded “middle-income” trap. For China to succeed in becoming a wealthy country, it must grow its real GDP to between $18 and $20,000 per capita. To reach this target, they must increase their installed copper base from 260 pounds per person currently to 360 pounds. With a population of 1.4 bn, China will need to install an additional 100 mm tonnes of copper to reach its economic goals. Assuming China grows at 5% per year, it will reach $19,000 per capita GDP by 2035. Annual copper consumption will need to average 15 mm tonnes per year for the next ten years in order to reach these targets.
Moreover, as dramatic as these projections are, they represent only the minimum level of copper investment required to meet their targeted level of GDP based on historical precedents. If China continues its large-scale renewable energy build-out, which is hugely copper-intensive, our projections may well prove conservative.
India, too, has reached an inflection point in its copper demand. Historically, Indian copper demand growth was relatively modest. With much lower levels of per capita GDP, India did not yet require an extensive copper base installation. That has now changed. Before 2020, India’s real GDP remained stubbornly below $2,000 per person. Over the last three years, economic growth accelerated, and we now estimate real GDP will reach $2,800 per capita by the end of the year. As our models predicted, Indian copper demand has started to surge.
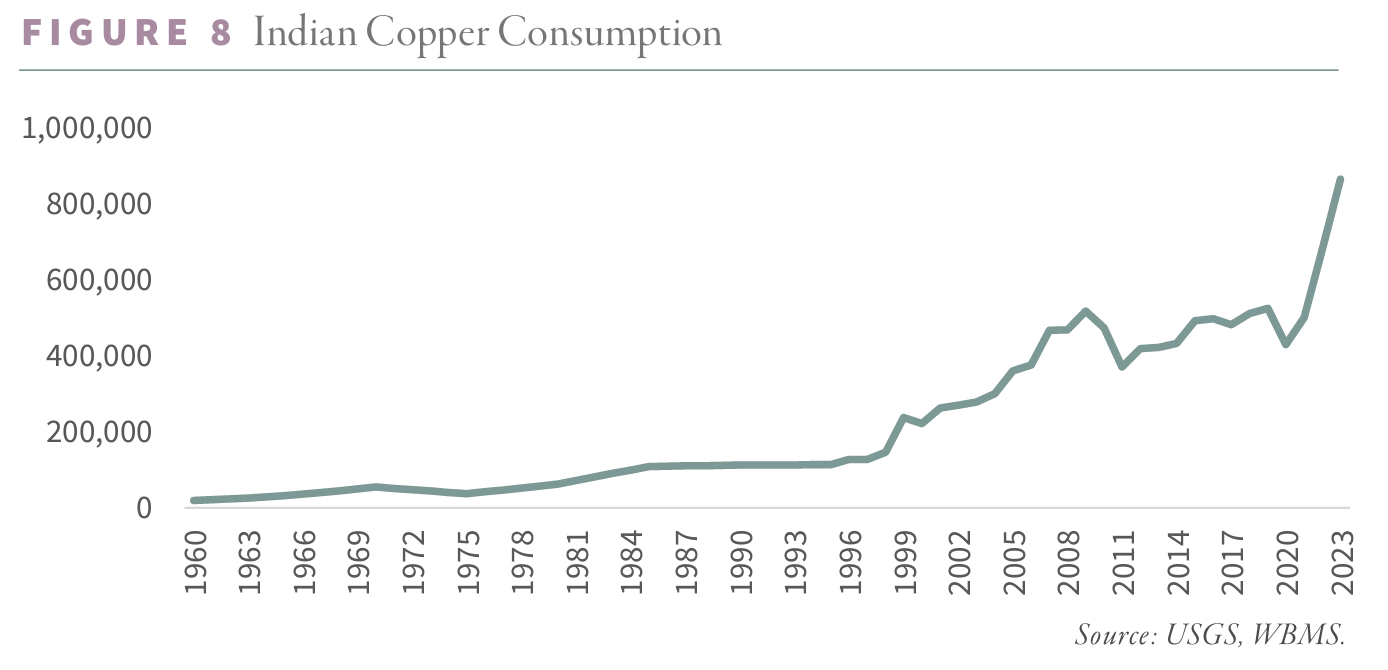
Indian copper consumption nearly doubled in the last two years alone. Despite the strong growth, India’s installed copper base remains woefully meager. By comparison, China had 45 pounds of copper installed per person when it reached $3,000 of real per capita GDP in 2003. Presently, we estimate India’s per capita copper base is only 15 pounds. Indian economic growth is expected to remain around 6% for the foreseeable future, which, along with its very low starting installed copper base, should increase its annual copper consumption nearly four-fold from current levels over the coming decade. Although this sounds extreme, Chinese copper demand increased by over four-fold between 2000 and 2010. Few analysts have commented on surging Indian copper demand; we believe this will soon change. Our models tell us India has finally emerged as a significant player in the copper market as we progress through the decade.
Another large non-OECD country has caught our attention: Indonesia. On September 20th, 2022, an article appeared in the Financial Times: “Indonesia’s Expected Success Story.” After years of disappointment, the authors argued that Indonesia boasted a booming economy and stable government. The economy had grown by 5% for two consecutive years and managed through COVID-19 and Russia’s invasion of Ukraine with only mild inflation. The rupiah was among the best-performing Asian currencies and the stock market was hitting all-time highs. A second article appeared in the Financial Times more than a year later: “Is Indonesia Finally Set to Become an Economic Superpower?” Significant infrastructure investment combined with a commodity export boom resulted in another year of growth that surpassed expectations. Leading economists projected that Indonesia could become the world’s seventh-largest economy by 2030.
Consistent with these articles (and of particular importance to us), Indonesian copper demand is now surging. For many years, Indonesia has been caught in a classic middle-income trap. After reaching a per capita GDP of $2,000 in 2005, it took the country nearly another twenty years to exceed $4,000. Indonesian prosperity was hampered by political instability, widespread corruption, and notable investment shortfalls – all of which have been covered in the press. However, we believe another factor contributed to the country’s lackluster growth: a shortage of installed copper, a dark irony given that Indonesia is home to Grasberg and Batu Hijau – two of the largest copper mines in the world. Nevertheless, when Indonesia first reached $2,000 of real per capita GDP in 2005, we calculated their total installed copper base only totaled 13 pounds per person – far too low for sustained economic growth. By comparison, China had 30 pounds invested per person in 2000 when it reached $2,000 of real per capita GDP.
Since 2005, Indonesia’s installed copper base has doubled to 35 pounds per person, still far too low. Anyone who has experienced Jakarta’s gridlock will agree that Indonesia’s investment in infrastructure remains terribly inadequate, a problem President Joko Widodo has prioritized. Massive new projects are underway, including the controversial plan to move the national capital from Jakarta to Kalimantan. Our models suggest Indonesia requires at least 80 pounds of installed copper per person to sustain a per capita real GDP above $4,000 – some 160% above present levels.
Indonesia faces another period of political uncertainty in the near term as President Widodo steps down later this year. However, we believe the current strong trends in copper consumption will persist, regardless of the country’s leadership. Although uncertainties remain, Indonesia requires much more installed copper to escape the middle-income trap. Based on current trends, Indonesia is quickly reaching its inflection point in copper consumption, similar to China in 2003 and India presently. If Indonesia ever earned $10,000 of per capita real GDP, we estimate it would have to increase its installed copper base from 35 to 200 pounds per person. Given its population of 275 mm, even if it takes another 15 years, assuming 5% economic growth, we expect Indonesia will consume over 1 mm tonnes annually – five times the current rate. In future letters, we will closely monitor Indonesia’s copper consumption, but it represents yet another potential source of incremental demand, which most analysts completely ignore.
In the short term, we remain incredibly bullish. Strong demand, supply disappointments, and meager exchange inventories leave the market susceptible to price spikes. Over the longer term, however, we are more cautious. Analysts have become universally bullish over a lack of long-term copper mine supply growth. In our last letter, we discussed Robert Friedland and the potentially disruptive technologies he will unleash on the hard-rock mining industry.
Mineral exploration has remained remarkably unchanged over the last 150 years. Geologists still often walk diligently, looking for the rock and soil alterations that suggest a deposit may be near the surface. Although induced-polarization geophysical studies have helped somewhat, their practical resolution only extends a few hundred meters deep. For the most part, geologists remain unable to see anything deeper. Any deeper discovery has primarily occurred accidentally, chasing a surface anomaly to depth. The mining industry has failed to replicate the advanced exploration tools perfected by the oil and gas industry over the last fifty years, until now.
With the introduction of Ivanhoe Electric’s Typhoon survey, hard-rock geologists can, for the first time, image mineral deposits several thousand meters below the surface. Unsurprisingly, 80% of all copper mine supply comes from deposits discovered within 200 meters of the surface – that is how deep the geologists could “see.” With Typhoon, that has changed. We know that copper porphyries exist at depths greater than 200 m, as several have been discovered by accident. However, the industry has never been able to explore for these large ore bodies efficiently from the surface.
Mr. Friedland is not the only one bringing “disruptive” exploration technologies to bear. Privately held KoBold Mining has had some initial success using artificial intelligence to help identify economic mineral deposits. On February 5th, the company announced a self-proclaimed “huge” copper discovery at its Mingomba project in Zambia. Although details remain scarce, CEO Josh Goldman has compared his discovery with Friedland’s Kakula, across the border in the Democratic Republic of Congo – arguably the most important copper discovery of the past two decades.
New technologies are not just limited to exploration. Using the same “pulsed power” technology that enables Typhoon, Mr. Friedland has also advanced a new technology that could disrupt how companies drill through, mine for, and crush rock. “I-Rox” uses pulsed power to pull rock apart from the inside, instead of being crushed from the outside—resulting in huge energy savings and cost. The implications could be transformative. There exists today huge quantities of low-grade sulfide ores—ores that are presently uneconomic to mine and process because of their low grades.
If I-ROX can deliver on its promise to reduce energy consumption by an order of magnitude, mining companies could quickly begin developing previously unprofitable projects. Given the vast amount of identified but uneconomic copper deposits, I-ROX could single-handedly change the supply dynamics of the industry. The copper industry has an interesting recent historical parallel: the introduction of solvent-extraction / electro-winnowing (SX/ EW) in the late 1980s. Before introducing SX/EW, copper miners could not economically unlock their vast inventory of low-grade oxide deposits. Once the industry adopted SX/ EW, oxide copper surged to nearly 20% of total mine production in just ten short years, resulting in a huge price-depressing glut.
Mr. Friedland and I spoke at a mining conference in New York City in late January. In his remarks, he used the term “disruptive” at least six times when describing Typhoon and I-ROX. We could not agree more.
As if Mr. Friedland has not been busy enough, Ivanhoe Mines, the operator of Kamoa-Kakula in the DRC, recently announced a new world-class discovery adjacent to their existing operation with its “Western Forelands.” The company recently announced two discoveries: Kiala and Kitoko. In addition, Ivanhoe Mines released an initial resource estimate for the Mokoko deposit, first reported in 2018. With an initial resource of nearly 5 mm tonnes of indicated copper at an average grade of 3.5% using a 1% cut-off, Mokoko already ranks as one of the most significant and highest-grade copper discoveries of the past decade. The deposit remains open in nearly every direction and we expect it will grow as the company continues drilling. Given its high-grade core and volume, it is easy to see Makoko becoming a large 200,000 tonnes producer based on its initial resource alone.
Ivanhoe Mines also announced a small maiden resource for Kiala of 200,000 tonnes of contained copper grading 2.67% at a 1% cut-off. Although small, the deposit helps validate the geological model and will grow from here. Lastly, the company announced drill results from the high-grade Kitoko discovery. These results were fascinating, as we believe they open up a new potential geological trend and further confirm Ivanhoe’s understanding of the Western Forelands Basin. All these Western Foreland discoveries were made without any help from Mr. Friedland’s Typhoon technology.
Before the Kitoko discovery, exploration geologists believed copper mineralization was primarily hosted in a sandstone layer rising above the basement rock. Kitoko validates the theory that copper can be hosted directly adjacent to the conglomerate bedrock. As a result, an astonishing 175 km of additional strike length now has meaningful exploration potential. One particular drill hole at Kitoko returned a 5-meter intercept grading an astounding 11.6% copper, suggesting the deposit has at least the potential for an ultra-high grade zone similar to those found at Kakula, a mere 25 km away.
The potential in the Western Forelands is enormous. Ivanhoe Mine’s DRC copper production has already affected the global copper mine supply. For the first ten months of 2023, global mine supply grew by 400,000 tonnes, nearly half attributable to the Kamoa-Kakula’s Stage 2 expansion. Stage 3 will come online by the end of 2024 and will add another 200,000 tonnes of copper mine supply.
Although the Western Forelands will not come online for several years, we must monitor the project closely. Most analysts are convinced that copper mine supply can never grow, but we believe we may be on the verge of a significant investment boom, led by a whole new exploration cycle—led primarily by new technologies.
Intrigued? We invite you to download or revisit our entire Q4 2023 research letter, available below.

Registration with the SEC should not be construed as an endorsement or an indicator of investment skill, acumen or experience. Investments in securities are not insured, protected or guaranteed and may result in loss of income and/or principal. Historical performance is not indicative of any specific investment or future results. Investment process, strategies, philosophies, portfolio composition and allocations, security selection criteria and other parameters are current as of the date indicated and are subject to change without prior notice. This communication is distributed for informational purposes, and it is not to be construed as an offer, solicitation, recommendation, or endorsement of any particular security, products, or services. Nothing in this communication is intended to be or should be construed as individualized investment advice. All content is of a general nature and solely for educational, informational and illustrative purposes. This communication may include opinions and forward-looking statements. All statements other than statements of historical fact are opinions and/or forward-looking statements (including words such as “believe,” “estimate,” “anticipate,” “may,” “will,” “should,” and “expect”). Although we believe that the beliefs and expectations reflected in such forward-looking statements are reasonable, we can give no assurance that such beliefs and expectations will prove to be correct. Various factors could cause actual results or performance to differ materially from those discussed in such forward-looking statements. All expressions of opinion are subject to change. You are cautioned not to place undue reliance on these forward-looking statements. Any dated information is published as of its date only. Dated and forward-looking statements speak only as of the date on which they are made. We undertake no obligation to update publicly or revise any dated or forward-looking statements. Any references to outside data, opinions or content are listed for informational purposes only and have not been independently verified for accuracy by the Adviser. Third-party views, opinions or forecasts do not necessarily reflect those of the Adviser or its employees. Unless stated otherwise, any mention of specific securities or investments is for illustrative purposes only. Adviser’s clients may or may not hold the securities discussed in their portfolios. Adviser makes no representations that any of the securities discussed have been or will be profitable. Indices are not available for direct investment. Their performance does not reflect the expenses associated with the management of an actual portfolio.