
The article below is an excerpt from our Q2 2023 commentary.
We believe oil is on the verge of a sharp rally. As we write this, West Texas Intermediate and Brent trade for $84 and $87 per barrel, respectively. We believe it will not be long before both are well above $100. Since the COVID bottom in March 2020, energy equities have been the best-performing sector of the S&P 500, while spot crude has been the best-performing asset class. However, for the twelve months ending June 2023, spot crude fell by 33%. The question has been whether the recent selloff was a consolidation amidst a broader rally or the start of a new bear market.
We are adamant in our belief that this bull market has only begun and prices will increase. All of the bullish elements we have discussed remain firmly in place: the industry is still highly capital-starved, oil demand is strong, and the US shales are depleting.
The recent selloff resulted from massive liquidations from various strategic petroleum reserves. For 2022, the US released 220 mm from its SPR, amounting to 607,000 b/d. Other countries liquidated 40 m b or 100,000 b/d. The US continued liquidating its SPR into 2023 as well. Although concerns surrounding Russia’s invasion of Ukraine may have prompted SPR liquidations last spring, this year’s sales were part of the Bipartisan Budget Act of 2018, which mandated the US to sell oil from the SPR to fund spending bills. During the second quarter, the US released 25 mm bbl from the SPR or 260,000 b/d.
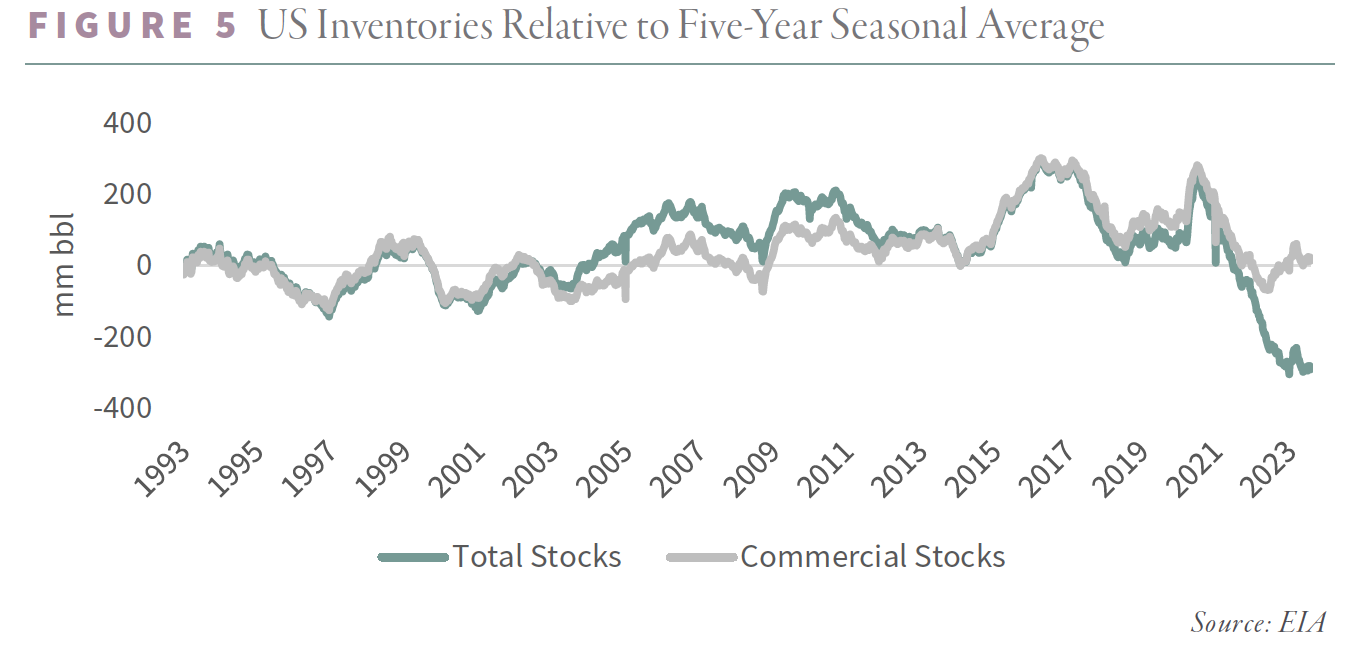
Our last letter explained the tight relationship between price and seasonally-adjusted inventory levels. Oil is fairly valued at $75 per barrel based only on commercial inventories. Including the now-depleted SPRs, oil should be trading at $120. Therefore, we estimate the impact of the SPR releases at anywhere between $30-40 per barrel. It is no coincidence that as soon as the US stopped liquidating its SPR at the end of June, oil bottomed and has since rallied 20%.
The Bipartisan Budget Act SPR sales automatically “phased out” if reserves reached 350 mm barrels. When Congress passed the Act, the SPR held 650 mm barrels, and it is likely few policymakers ever expected to use the “phase out” provision. However, with the SPR now at just 347 mm barrels, the Act no longer allows further liquidation. Just last week, the administration announced it would cancel all additional planned sales from the SPR. With the US no longer selling several hundred thousand barrels per day from its strategic reserves, commercial inventories are set to fall sharply throughout the rest of the year, pushing prices higher.
Even with the unprecedented SPR liquidation, commercial inventories remained subdued. Inventories peaked at 280 mm barrels above and bottomed at 60 mm below the five-year average in 2020 and 2022, respectively. Presently, inventories are in line with the five-year average. Including the SPR, inventories are 300 mm barrels below five-year averages – a record deficit.
Global inventories are just as tight. OECD commercial inventories went from 300 mm bbl above to 300 mm bbl below five-year averages between 2020 and 2022 and currently stand at 95 mm bbl below average. Including government stockpiles, inventories remain 400 mm bbl below average – another record.
Based upon our supply and demand estimates, inventories could draw by 360 mm bbl between now and yearend, leaving commercial and total inventories at dangerously-low levels.
Despite headlines to the contrary, the oil market remained extremely tight over the past twelve months. Governments effectively hindered the bullish price signal by liquidating vast quantities from their strategic reserves. This is unlikely to continue, clearing the way for prices to increase.
Most analysts attribute the selloff to recession fears and weak demand, but our data tells us consumption remains robust. For nearly fifteen years, headlines have called for the “end of oil demand.” As recently as 2020, many agencies, including the International Energy Agency (IEA), predicted that 2019 was the peak in global oil demand. Hardly four years later, consumption set a new record and shows no signs of slowing. Any worries about long-term structural oil demand are entirely misguided for at least the next decade.
The oil market will be driven higher by lackluster supply caused by years of underinvestment. Demand, meanwhile, will enjoy a persistent tailwind and continue to consistently surprise to the upside. In our following letter, we will write extensively on global commodity demand; today, we offer a preview.
Energy consumers fall into two categories: those in the developed world and those in emerging markets. The former comprises 17% of the world’s population and consumes 170 GJ per person of primary energy. The latter makes up 83% of the population (or seven billion people) and annually consumes less than 60 GJ per person. Each year, millions begin their move from emerging-market to lower-middle-income energy consumers.
As they prosper, their primary energy consumption triples from 60 to 170 GJ annually. This phenomenon will be the primary growth driver over the next twenty years. Analysts pontificate on EV penetration, but even the most aggressive scenarios cannot overcome this dramatic increase in primary energy demand per capita. Others worry about energy efficiency. Again, the move from emerging markets to lower middle-income energy consumers will eclipse any improvement in energy efficiency.
For example, over the last fifteen years, OECD per capita energy demand fell by 11%, primarily due to improved energy efficiency. However, non-OECD per capita demand surged by 25%, pushing global per capita demand higher by 5%: the so-called “S-Curve” at work. While it is true that, in theory, making something more energy efficient should reduce demand, in practice, the trend has been towards more demand, not less. More people are in the energy-intensive period of their development, moving from 60 GJ to 170 GJ of primary energy demand. According to Jevons’ Paradox, efficiency may lead to faster growth. In 1865, Jevons postulated that improved energy efficiency would lower costs and ultimately increase demand. While his Paradox is controversial, we believe there is evidence of this phenomenon in emerging market economies.
Amazingly, in their latest long-term forecast, the IEA projects global per capita primary energy demand will fall between now and 2035. Simply put, this cannot happen. The IEA (and others) will chronically miss the mark until they realize this.
The IEA has also warned about near-term oil demand; we believe these worries are similarly unfounded. In their latest Oil Market Report, the IEA revised down 2Q23, 3Q23, and 4Q23 demand estimates by 250,000 b/d. In their summary (which is released to the press ahead of the full report), they warned that “persistent macroeconomic headwinds, apparent in a deepening manufacturing slump, have led us to revise our 2023 growth estimate lower for the first time this year, by 220 kb/d.”
The IEA neglects to mention how they quietly revised historical demand higher for 2020, 2021, and 2022. They also revised 2024 estimates higher as well. Furthermore, the 1Q23 balancing item ran at a near-record 1.4 m b/d, suggesting global demand likely reached 101.9 m b/d – a record level for any quarter and a full 2.5 m b/d above 1Q22. In their longerterm Oil 2023 report, the IEA expects oil consumption to grow by 6% between now and 2030, or by 900,000 b/d, not materially lower than the fifteen years between 2005 and 2019 despite all the talk of EVs and efficiency. In 2020, the IEA predicted 2019 marked peak oil demand. Only a few years later, the IEA pushed its prediction to 2030. We have no doubt this revised out further as well.
While investors remain fixated on demand, they seem to neglect problems in the global oil supply. In our last letter, we wrote about depletion problems in the Permian basin. Over the past 15 years, the US shales were the only material source of non-OPEC+ growth. In turn, the Permian has represented most of all shale growth over the past five years. We warned that emerging depletion in the Permian would have a massive impact on global oil markets.
Since we last wrote, Permian depletion has accelerated. Last year marked the first time Permian productivity per lateral foot decreased year-over-year, falling by 7%. For the first three months of 2023, productivity per foot fell by a further 4% compared with 2022. According to the Energy Information Agency (EIA), by August, the Permian will be growing by only 360,000 b/d year-on-year, compared with nearly 700,000 b/d as recently as February. Our models suggest that year-on-year Permian growth will be less than 100,000 b/d by year-end and turn negative in early 2024. Although the next few months may be bumpy, we believe the Permian will definitively roll over sometime in 2024 as companies run out of their best drilling prospects. Despite high prices, producers dropped fourteen rigs in the Permian over the past three months, potentially signally inventory exhaustion. The other US shales are not faring any better. Shale production outside the Permian has not grown in nearly three years, despite oil rallying from $20 to $75 per barrel. The only material source of non-OPEC+ growth over the past fifteen years is about to peak.
The IEA meanwhile predicts non-OPEC+ production ex-US to grow by 400,000 b/d this year. However, we believe this is too optimistic. Since first releasing their projections last summer, the IEA has systematically revised non-OPEC+ ex-US production lower by 300,000 b/d and we believe this trend will continue.
As non-OPEC+ production falters, OPEC+ will gain market share and pricing power. In early August, Saudi Arabia announced they would extend their production cuts by at least another month. Saudi produced less than 10 m b/d in May and June – a thirteen year low. Some analysts view the cuts as an admission of weak global demand. Based on our demand analysis, we disagree. We and other analysts believe the cuts are necessary to rest aging fields, including Ghawar. Still, others argue the Saudis are merely offsetting government SPR liquidations. Whatever the case, several years ago, the Saudis would have been far too worried about losing market share to the growing shales to cut production. That concern is now gone.
According to the IEA, demand will average 103.2 m b/d in the second half of 2023. Global supply (including OPEC NGLs, processing gains, and biofuels) will only reach 101.5 m b/d, leaving the market undersupplied by a massive 1.7 m b/d. We think this understates the problem. The balancing item ran at 1.3 m b/d in the first quarter, suggesting demand was understated. Adjusting demand higher by 1 m b/d for the rest of the year implies a 2.7 m b/d deficit that would take inventories down by over 400 mm bbl by December 31st. At that point, commercial inventories would reach a record 500 mm bbl deficit while total inventories would reach a record 820 mm bbl deficit – the lowest levels since our data begins.
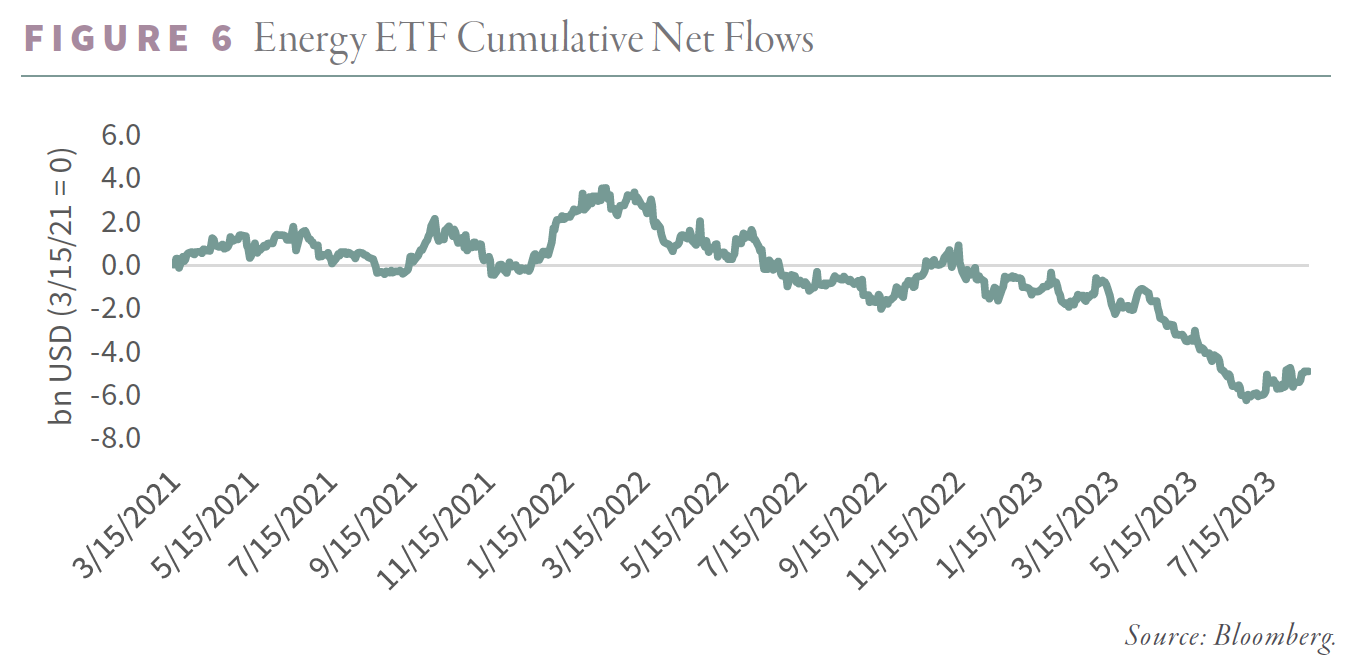
We are amazed at the level of investor apathy and disinterest. Despite three years of market leading performance, funds continue to flow out of significant energy ETFs, including the XOP and XLE.
The past six months saw the lowest level of energy IPOs and secondary offerings in nearly 25 years. Capital spending trends remain depressed and corporate valuations are at record lows. Energy remains less than 4% of the S&P 500, nearly two-thirds below its long-term average. Perhaps unsurprisingly, Mr. Buffett has steadily added to his Chevron and Occidental Petroleum positions. Berkshire Hathaway added to his Occidental Petroleum position in the second quarter and now owns 25% of the company. Investors have radically undercapitalized the energy industry over the past ten years, and the results are becoming apparent. The only way to attract capital back to the space will be through solid returns. We believe that by the end of this bull market, everyone will argue that energy is again the “must-own” sector. Still, for the time being, contrarian value investors are being offered an excellent opportunity with solid fundamentals and attractive valuations. Investors will not be able to remain apathetic for much longer.
Intrigued? We invite you to download or revisit our entire Q2 2023 research letter, available below.

Registration with the SEC should not be construed as an endorsement or an indicator of investment skill, acumen or experience. Investments in securities are not insured, protected or guaranteed and may result in loss of income and/or principal. Historical performance is not indicative of any specific investment or future results. Investment process, strategies, philosophies, portfolio composition and allocations, security selection criteria and other parameters are current as of the date indicated and are subject to change without prior notice. This communication is distributed for informational purposes, and it is not to be construed as an offer, solicitation, recommendation, or endorsement of any particular security, products, or services. Nothing in this communication is intended to be or should be construed as individualized investment advice. All content is of a general nature and solely for educational, informational and illustrative purposes. This communication may include opinions and forward-looking statements. All statements other than statements of historical fact are opinions and/or forward-looking statements (including words such as “believe,” “estimate,” “anticipate,” “may,” “will,” “should,” and “expect”). Although we believe that the beliefs and expectations reflected in such forward-looking statements are reasonable, we can give no assurance that such beliefs and expectations will prove to be correct. Various factors could cause actual results or performance to differ materially from those discussed in such forward-looking statements. All expressions of opinion are subject to change. You are cautioned not to place undue reliance on these forward-looking statements. Any dated information is published as of its date only. Dated and forward-looking statements speak only as of the date on which they are made. We undertake no obligation to update publicly or revise any dated or forward-looking statements. Any references to outside data, opinions or content are listed for informational purposes only and have not been independently verified for accuracy by the Adviser. Third-party views, opinions or forecasts do not necessarily reflect those of the Adviser or its employees. Unless stated otherwise, any mention of specific securities or investments is for illustrative purposes only. Adviser’s clients may or may not hold the securities discussed in their portfolios. Adviser makes no representations that any of the securities discussed have been or will be profitable. Indices are not available for direct investment. Their performance does not reflect the expenses associated with the management of an actual portfolio.