
The article below is an excerpt from our Q4 2022 commentary.
“BP’s CEO Plays Down Renewables Push and Returns Lag”
“Mr. Looney [(BP’s CEO)] has said he is disappointed in the returns from some of the oil giant’s renewable investments […].”
- The Wall Street Journal, February 1st, 2023
Over the last five years, outside ESG advocates have pressured some super-majors into decisions that hugely impacted financial performance.
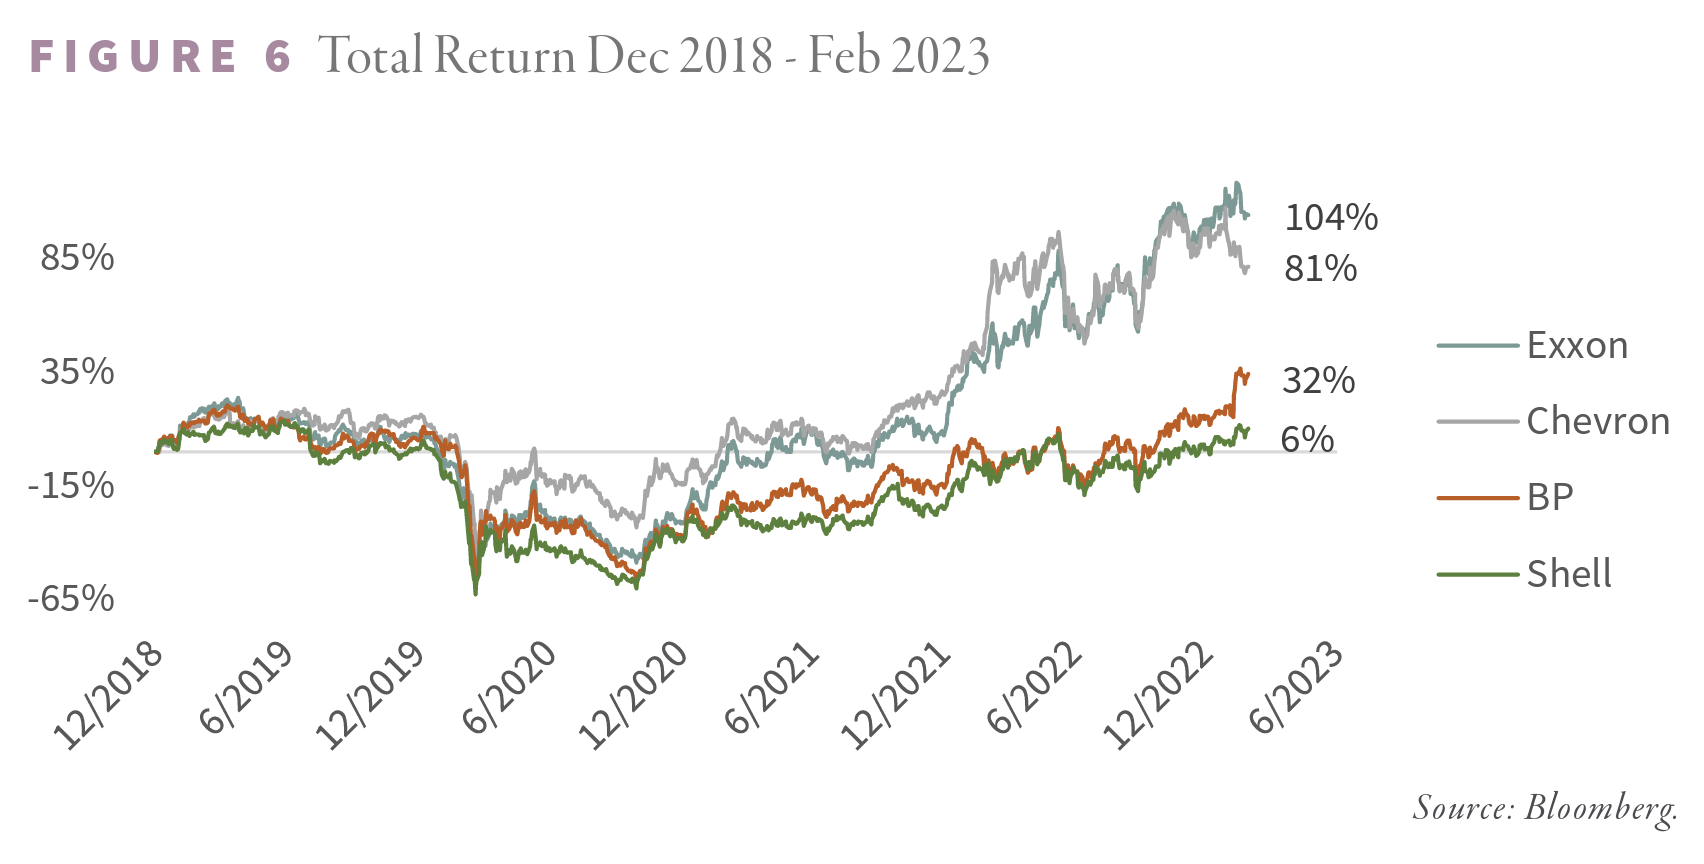
A considerable performance divergence has emerged between those companies that have bowed to ESG pressures and those that have not. Over the last five years, BP and Shell have actively pursued various ESG initiatives, while Exxon and Chevron have been more measured. The former have dramatically underperformed the latter.
Since the end of 2018, BP and Shell generated only modest returns. Exxon and Chevron generated 104% and 81% returns, respectively. Their shareholders also outperformed the general stock market. Investors were rewarded by owning Exxon and Chevron, two companies that stuck with their traditional hydrocarbon business.
We have discussed how super-majors have come under intense ESG pressure. Exxon replaced four members with those proposed by an ESG fund holding 0.04% of its common stock.
In response to a lawsuit filed by an environmental group, the courts ordered Royal Dutch Shell to reduce its CO2 output by 45% before 2030. Shell has since come under attack from an activist shareholder that demanded it breaks itself in two. One company would be focused on hydrocarbons, and the other on renewables. The oil and gas entity would be starved of capital, which would be redirected into the renewable entity. The activist investor must have neglected to mention that renewable investment returns dramatically lag those of traditional E&P.
Shell’s board recently announced it was being sued (this time in English courts) by ClientEarth, an “environmental law firm.” The suit accuses Shell’s board of “failing to manage the company’s climate risks” and “persisting with a flawed transition strategy.” ClientEarth is attempting to replicate the success of Dutch environmentalists who won a lawsuit in 2021 under similar circumstances.
A US Congressional panel excoriated the super-majors only two years ago for not reducing their upstream capital spending fast enough. Today, the Biden administration criticizes these companies for not increasing their hydrocarbon production.
Chevron reported record 2022 profits and a $75 bn share buyback program. In response, the Biden administration publicly criticized Chevron. “For a company that claimed not too long ago that it was “working hard” to increase oil production, handing out $75 bn to executives and wealthy shareholders sure is an odd way to show it. We continue to call on oil companies to use their record profits to increase supply and reduce cost for the American people,” said a White House spokesman. A White House spokesman also lashed out at Exxon following its 2022 profits a few days later: “It’s outrageous that Exxon has posted a new record for Western Oil company profits after the American people were forced to pay such high prices at the pump.”
Although the administration did not mention any specific recourse in these tirades, imposing a “windfall’ profit tax is a serious consideration. Damned if you do, damned if you don’t. The life of a super-major gets more complicated by the day. Even though all five super-majors have come under ESG pressures, responses have significantly differed. Exxon and Chevron have only minimally tried to shrink upstream capital spending. BP and Shell have decided to severely restrict upstream spending and redirect the capital into renewable energy.
BP and Shell’s decision has negatively impacted their financial returns. The vastly different directions taken by Exxon and Chevron on one side and Shell and BP on the other have already been reflected in the financial returns and the stock market performance of all four companies.
Shell’s ESG pressures have come from the outside—first from the Dutch government, next from an activist shareholder. In the case of BP, the ESG pressures have come from within the company. Twenty years ago, BP’s chief executive, Sir John Brown, rebranded the company as “Beyond Petroleum” and pledged to keep emissions constant and be a “steward of the planet.” Substandard returns on the original renewable investments under Sir Brown were eventually wound down and sold. However, Sir John Brown’s green legacy at BP has re-emerged. BP’s current CEO, Bernard Looney, worked directly for Sir Brown and was the BP executive responsible for managing the Horizon deep-water drilling blowout disaster and its intensely difficult multi-year cleanup, which has again directed BP in the “Beyond Petroleum” direction. Possibly influenced by Sir Brown and the deep-water Horizon drilling disaster, Mr. Looney has aggressively rekindled Sir Brown’s goal of making BP a transitional energy powerhouse. Mr. Looney promised to slash BP’s hydrocarbon production by 40% by 2030 and that renewables would represent 50% of all capital expenditures.
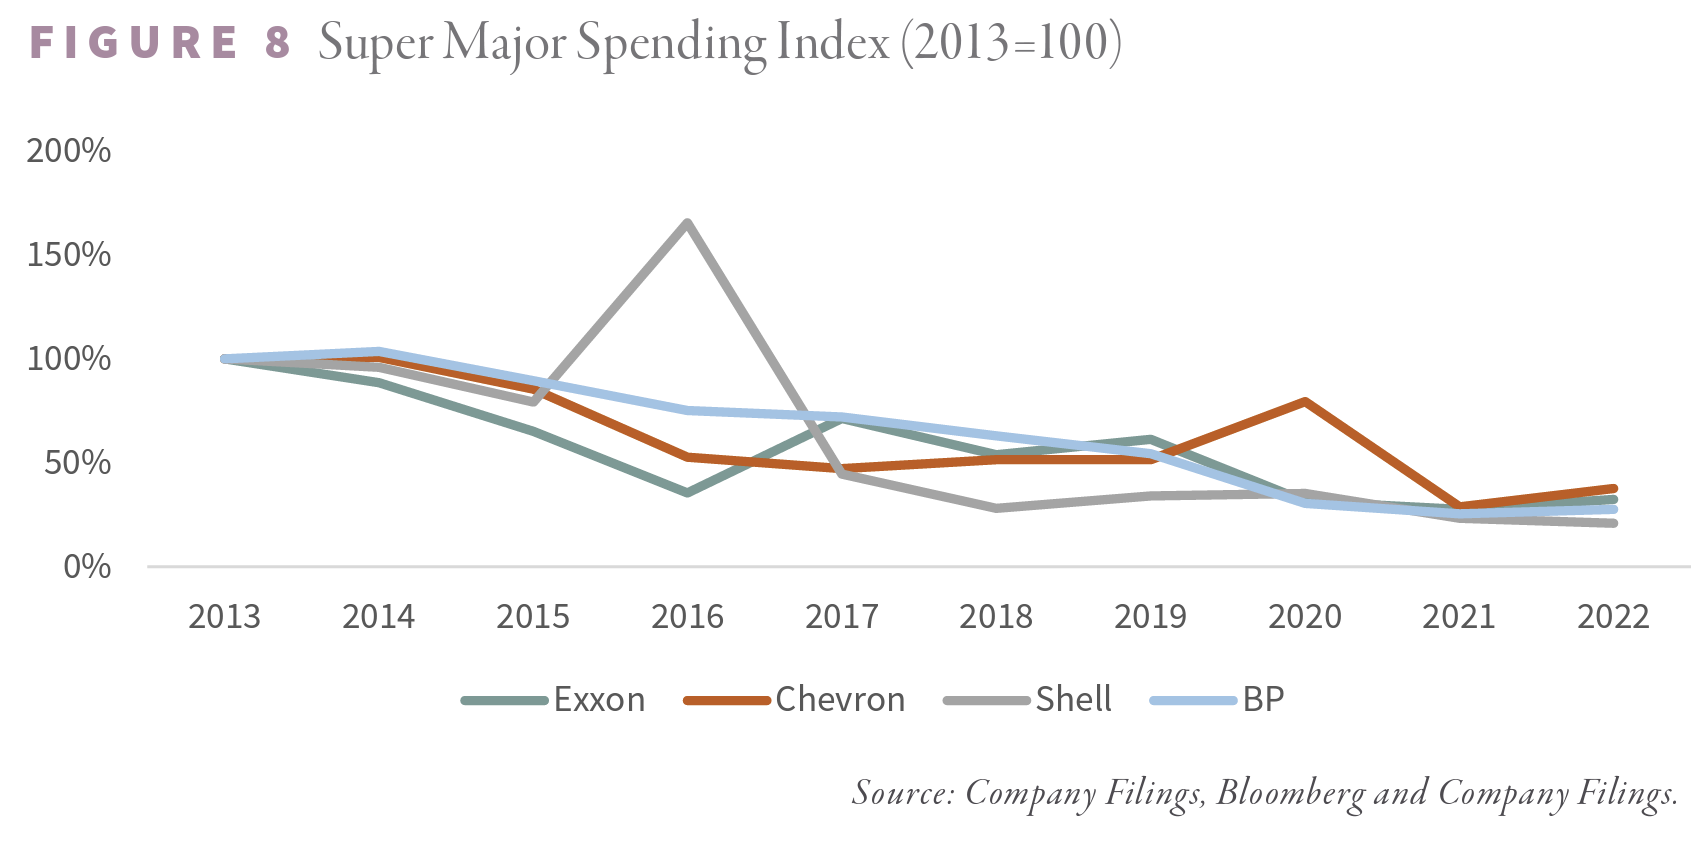
ESG pressures have produced large underinvestment in Shell’s and BP’s traditional upstream businesses. Between 2007 and 2016, Exxon, Chevron, Shell, and BP each invested robustly in their upstream business. Exxon spent $20 per BOE in upstream capital expenditures ($30 bn per year). Chevron spent $26 per BOE ($25 bn per year), Shell spent $25 per BOE ($29 bn per year), and BP spent $24 per BOE ($17 bn per year).
Capital allocation diverged around 2016. Over the next six years, from 2017 to 2022, Shell spent only $7.50 per BOE ($10 bn). By 2022, Shell was spending only $8 bn on its upstream assets – 70% below its 2006-2016 average.
BP’s upstream capital spending followed a similar pattern. Between 2016 and 2022, BP slashed upstream capital spending to an average of only $9 per BOE ($8.7 bn per year), and by 2022 spent only $6.50 per BOE ($5.2 bn). Like Shell, BP reduced its upstream spending by 75% in 2022 compared with its 2006-2016 average.
Even though Exxon and Chevron also cut their capital spending significantly, their upstream investments remained much more significant on a per-BOE basis.
Between 2016 and 2022, Exxon’s annual upstream capital expenditures averaged $12 per BOE ($17 bn annually) -- 50% more than Shell and BP. In 2022, upstream capital spending reached $13 per BOE ($17 bn) – 60% more than Shell and double BP. Between 2016 and 2022, Chevron spent $14 per BOE ($16 bn per year) – 90% and 70% more than Shell and BP respectively. In 2022, Chevron spent $10 per BOE ($10 bn) -- 13% and 37% more than Shell and BP, respectively.
Although Exxon and Chevron cut upstream capital expenditures by nearly a third between 2019 and 2022, they outspent Shell and BP, which cut their spending by roughly one-half. More robust spending by Exxon and Chevron resulted in much shallower production declines than either Shell or BP.
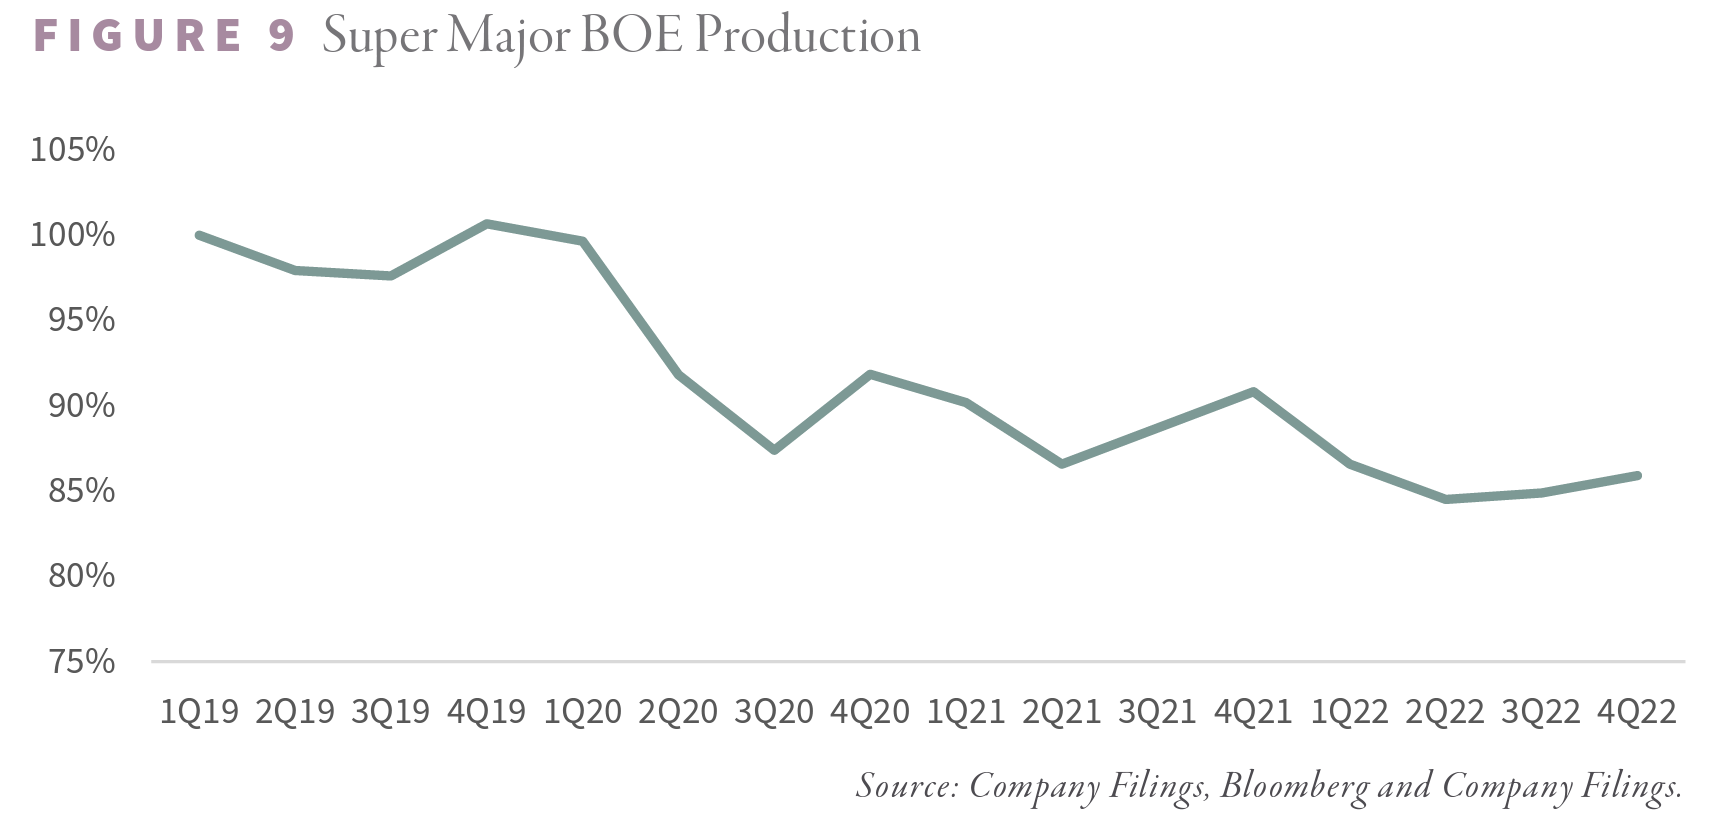
Since 2019, Exxon and Chevron’s oil and gas production has remained relatively steady. From 1Q2019 to 4Q2022, Exxon and Chevron’s oil and gas production on a BOE basis fell 4% and 1%, respectively. In comparison, Shell and BP’s production fell almost 40% and 15% over the same two-year period, respectively.
As a result of the difference in upstream spending, Shell and BP’s earnings have lagged Exxon and Chevron’s, despite rising energy prices over the last two years. Exxon went from earning $3.43 to $14.05 per share between 2019 and 2022 – an increase of 300%. Chevron went from earning $6.00 to $19.58 per share over the same period – an increase of 226%. By comparison, Shell went from earning $1.95 to $5.72 between 2019 and 2022 – an increase of only 193%. BP went from $0.54 cents in 2019 to $1.06 in 2022 – the laggard of the group by far.
BP’s poor earnings came from two ESG-related sources. Not only did BP reduce traditional exploration and production investment, but they also redirected the capital into a renewable portfolio earning sub-standard returns. By February 2023, BP’s CEO was forced to admit the poor renewable performance on his fourth-quarter earnings call.
BP’s decision to minimize high EROI (energy return on investment – our preferred metric for energy efficiency) hydrocarbon investment and to increase low EROI renewable investments has impacted its profitability. BP should serve as a warning to other super-majors contemplating a similar strategy. Dismal earnings are likely to follow.
As we have discussed extensively over the last several years, renewables’ EROI is terrible compared with traditional hydrocarbons. We firmly believe that high EROI investments lead to high financial returns. Conversely, low EROI investments are much less financially profitable. It is no surprise that companies that are maintaining their upstream spending are seeing superior financial returns compared with those that redirected investment into renewables.
BP’s renewable investments remain relatively small. Still, BP has admitted that its renewable portfolio’s investment performance has negatively impacted total profitability.
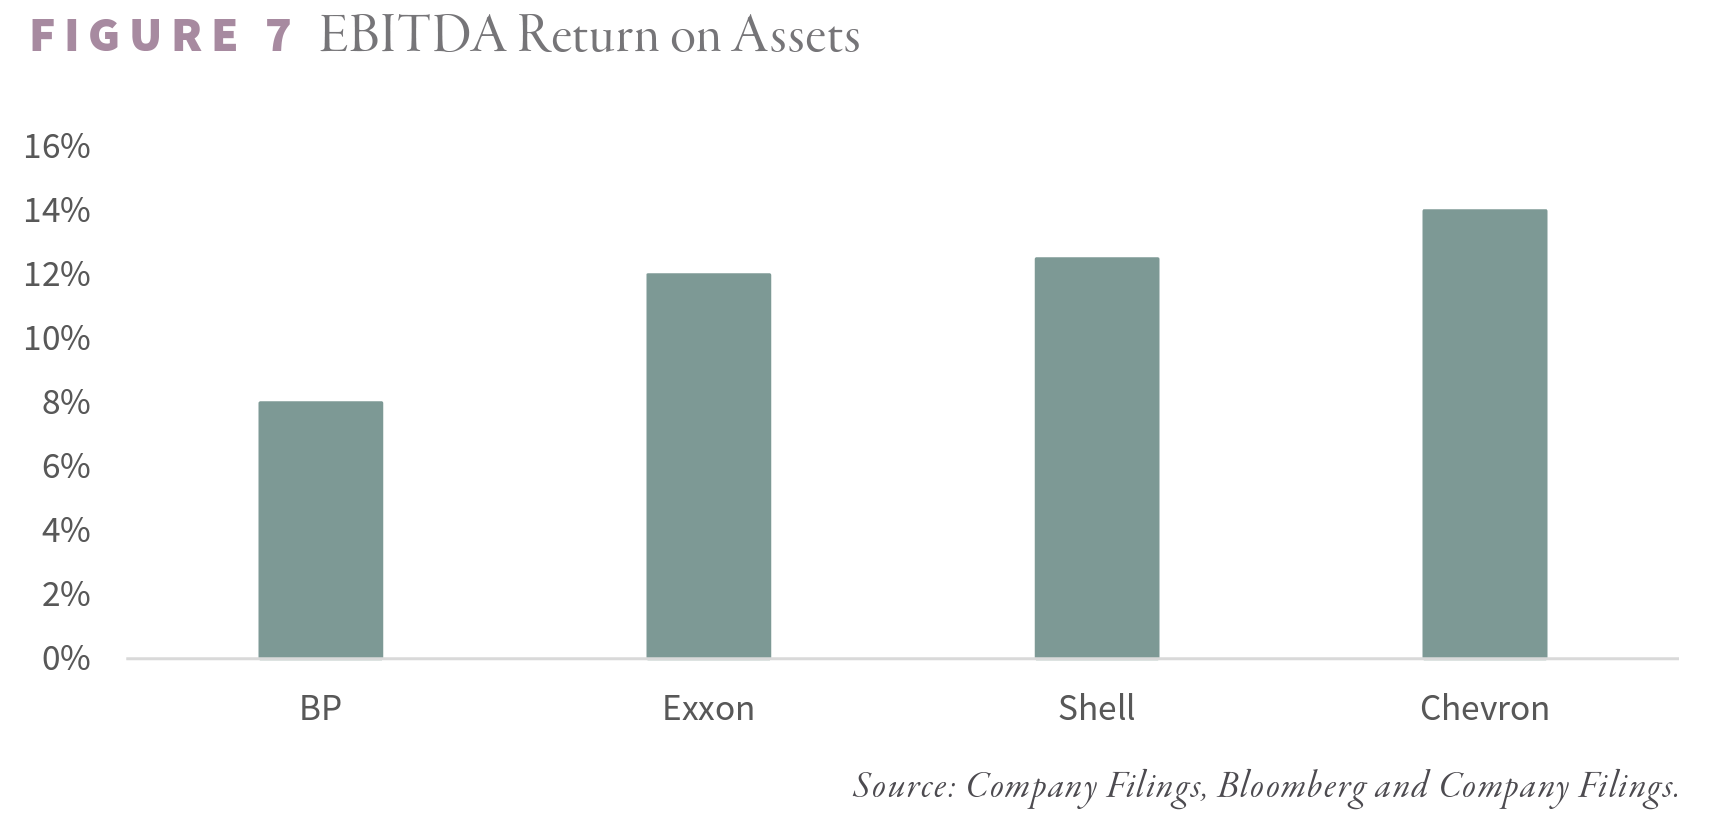
Since 2019, BP generated an EBITDA return on assets of 7.9% compared with 12% and 14.2% for Exxon and Chevron, respectively – nearly 35% and 45% lower. Shell, which curtailed upstream spending but did not divert capital into renewables to the same extent as BP, enjoyed a return on assets of 12.6%.
Several years ago, BP announced its intentions to reduce hydrocarbon production by 40% compared with 2019 and to have annual renewables investment reach 50% of total capital spending by 2030. In 2021 BP had a renewable base of 3.3 GW with a goal of reaching 50 GW by 2030. BP planned on increasing offshore wind and biofuel production to meet their lofty goal. BP just announced the takeover of Archaea, a landfill methane producer. BP paid $4.1 bn for a company today with only 6,000 BOE of production and hydrogen. Their hydrogen portfolio includes the massive “Asian Renewable Energy Hub” (AREH) in western Australia. AREH will produce green hydrogen using electricity sourced from wind and solar farms. BP owns 40% of the project, whose total capital cost is estimated at $50 bn. According to our research, renewable-powered green hydrogen has amongst the lowest EROI of any energy source – far below oil and gas. If we are correct, BP’s $20 bn investment will yield inferior returns, even worse than those incurred in the rest of their renewable portfolio.
BP invested $1 bn in multiple US east coast offshore wind projects that may never produce power. For those interested in the recent travails of offshore wind farms, please read the Renewable section of this letter, where we discuss the Commonwealth Wind quagmire off the coast of Martha’s Vineyard.
BP already has a sub-standard return on assets compared with its peers. If they continue with their ambitious renewable plans, their profitability will likely deteriorate significantly from here. BP is a prime example of how renewables impact a company’s profitability. Exxon, Chevron, and Shell should all take notice. An activist shareholder has called for Shell to reduce upstream capital spending further and divert the investment into renewables.
Shell’s underperformance thus far has come from cuts to its highly profitable upstream oil and gas business and not from an increase in renewables. Shrinking production combined with increased renewable investment would likely further hurt earnings and stock performance.
Update on the lack of super-major production growth:
All five companies in our super-major survey increased capital spending and production in 4Q2022. Spending grew 22% compared with 2Q2022 from $11.1 bn to $13.6 bn.
Year-over-year, super-major capital spending is up 25%. Increased spending was driven by Chevron (up 37%), Exxon (up 28%), and Shell (up 22%). BP and Total grew their spending much less: 10% and 5%, respectively.
Production still has downward momentum. Although liquids production grew 3% sequentially, it remained 1% below the same period in 2021. Total grew the most year-on-year (up 5%), followed by Exxon (up 3%). Chevron and BP saw production fall 4%, while Shell’s oil production collapsed 8% year-on-year. On the natural gas side, production continues to slip. Sequential and year-on-year gas production fell 1% and 3%, respectively.
Combined, barrel of oil equivalent (BOE) production is up 1% sequentially but down 3% year-on-year. Since 1Q19, total BOE production has been down a staggering 14%. While downward production momentum may be slowing, the super-majors continue to shrink.
Intrigued? We invite you to download or revisit our entire Q4 2022 research letter, available below.
Registration with the SEC should not be construed as an endorsement or an indicator of investment skill, acumen or experience. Investments in securities are not insured, protected or guaranteed and may result in loss of income and/or principal. Historical performance is not indicative of any specific investment or future results. Investment process, strategies, philosophies, portfolio composition and allocations, security selection criteria and other parameters are current as of the date indicated and are subject to change without prior notice. This communication is distributed for informational purposes, and it is not to be construed as an offer, solicitation, recommendation, or endorsement of any particular security, products, or services. Nothing in this communication is intended to be or should be construed as individualized investment advice. All content is of a general nature and solely for educational, informational and illustrative purposes. This communication may include opinions and forward-looking statements. All statements other than statements of historical fact are opinions and/or forward-looking statements (including words such as “believe,” “estimate,” “anticipate,” “may,” “will,” “should,” and “expect”). Although we believe that the beliefs and expectations reflected in such forward-looking statements are reasonable, we can give no assurance that such beliefs and expectations will prove to be correct. Various factors could cause actual results or performance to differ materially from those discussed in such forward-looking statements. All expressions of opinion are subject to change. You are cautioned not to place undue reliance on these forward-looking statements. Any dated information is published as of its date only. Dated and forward-looking statements speak only as of the date on which they are made. We undertake no obligation to update publicly or revise any dated or forward-looking statements. Any references to outside data, opinions or content are listed for informational purposes only and have not been independently verified for accuracy by the Adviser. Third-party views, opinions or forecasts do not necessarily reflect those of the Adviser or its employees. Unless stated otherwise, any mention of specific securities or investments is for illustrative purposes only. Adviser’s clients may or may not hold the securities discussed in their portfolios. Adviser makes no representations that any of the securities discussed have been or will be profitable. Indices are not available for direct investment. Their performance does not reflect the expenses associated with the management of an actual portfolio.