
“For the first nine months of the year, Chinese imports are up an incredible 50% year-on-year. We estimate that total 2018 LNG imports could approach 8 bcf/d – far above analysts’ expectations.”
Tank Ship Transporting Liquified Natural Gas (LNG)
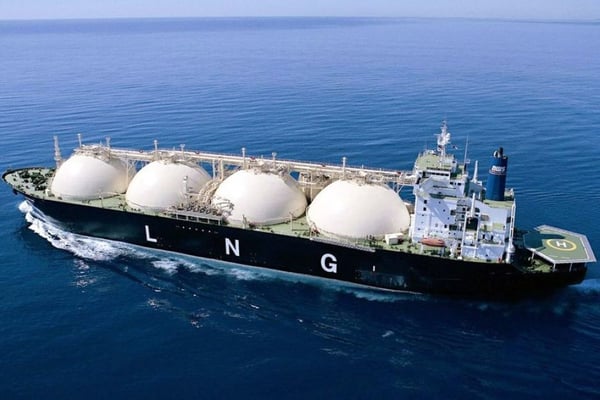
Image source: ABC.net.au
At -260°F, liquified natural gas is a very cool story - both literally and figuratively.
We have followed this market for many years, though we have not written about it since the summer of 2014. At that time, we explained how global demand projections from most analysts and large consultants were dramatically understated.
Most analysts take a so-called “bottoms up” approach in which they model each regasification import terminal in order to determine a country’s future LNG demand. Using such an approach, planned liquification capacity was expected to overwhelm new regasification terminals and the market was expected to be in perpetual surplus as the decade progressed.
Diagram of a Regasification Terminal
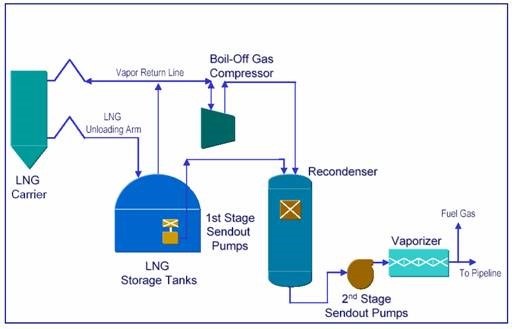
Image Source: MarineInsight.com
Our models used a wildly different approach and came to a completely different answer. We studied the relationship between real GDP per capita and a country’s energy mix. We noticed that countries with lower per capita GDP burned more coal, while richer countries burned more natural gas. While coal is a very dirty fuel, it is nevertheless very cheap. Natural gas is incredibly clean burning compared with coal. However, due to its low energy-to-volume ratio (i.e., because it is a gas), it requires a huge amount of infrastructure investment. As a result, a developing country cannot afford to burn natural gas, but as it gets richer its population becomes increasingly concerned about air quality and natural gas gains share.
Chinese LNG tanks at the Yangkou Port in Eastern China
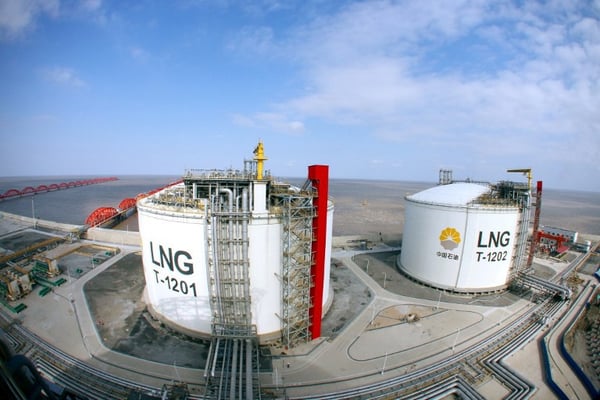
Image Source: RFA.org
The difference between these two methodologies led to wildly different views, particular as it related to China. For example, using a “bottoms-up” approach, most analysts at the time expected Chinese LNG demand to reach 6-7 bcf/d by 2020. Our models told us that demand would reach nearly twice this level. Based upon the relationship between GDP and natural energy penetration and announcements of long-term guidelines made at the time by various government officials, we assumed Chinese gas would go from 5% of total energy in 2013 to 10% by 2020. This equates to 50 bcf/d of total gas demand by the end of the decade. If domestic gas production were able to double from 10 bcf/d to 20 bcf/d, and pipeline imports went from 2 bcf/d to 13 bcf/d, then total supply would equal 33 bcf/d, implying a deficit of 18 bcf/d. While 8 bcf/d would be met from planned regasification facilities, that would leave another 11 bcf/d of latent demand. If even 25% of this were met by incremental LNG imports, then total imports would reach 12 bcf/d – twice the level put forward by most analysts.
After some initial delays, we think we are finally starting to see these extremely strong trends taking hold today. The delays were caused by Japan’s decision to leave its nuclear reactors offline longer than anyone expected, following the Fukushima incident. Japan turned to natural gas power plants to make up for this. With Japan as an aggressive buyer, we believe the LNG supply simply was not available for Chinese imports until Australian and US cargos came to market over the last year.
At present, Chinese LNG demand is surging. For the first nine months of the year, Chinese imports are up an incredible 50% year-on-year. We think this will continue. We estimate that total 2018 LNG imports could approach 8 bcf/d – far above analysts’ expectations.
However, it’s not just China that will drive LNG demand going forward. Using our same methodology, we expect India, Turkey, Pakistan, and Thailand will all see sharply higher demand for LNG volumes between now and 2025. Furthermore, as domestic demand comes in stronger than expected, several LNG exporting countries are facing feed gas shortages. Indonesia, Egypt, and Brazil have all run into problems and limited exports since we first identified this potential bottleneck several years ago. Indonesia’s new large-scale export terminal on Papua is now expected to entirely serve domestic gas demand, and as a result, no volumes are expected to reach the export market.
This blog contains excerpts of our Q3 2018 commentary, INTO THE "RED ZONE" WE GO. If you are interested in reading further on this subject, we encourage you to download the full commentary here.

We will be releasing our Q4 2018 Commentary in the near future. Please subscribe here to our updates if you would like to be notified when it's available.