
The article below is an excerpt from our Q4 2022 commentary.
Crude oil fundamentals are very tight and risk getting considerably tighter. Investors continue to starve energy companies of much-needed capital, the lifeblood of a solid supply base. Although the trend of lower spending has been in place for several years, our models tell us we are nearing a critical inflection point: the growth in shale oil production -- the only source of non-OPEC+ production growth over the past two decades --- may be coming to an end.
Few of us properly appreciate the importance of the shales. Not only were they the only source of incremental growth over the past decade, but they were also tremendous in absolute terms. Between 2010 and 2020, US shale oil production grew by 7.6 mm b/d, while natural gas liquids (nearly all from shale) increased by 4.0 m b/d. Total liquid production from the US shales grew by 11.6 mm b/d – more than Saudi Arabia’s production of 10.5 m b/d. Shale gas production grew an incredible 65 bcf/d over the same period. When converted to barrels of oil equivalent, shale gas added another 10.8 m boe/d – equivalent to a second Saudi Arabia.
Few people have acknowledged shale’s importance to global oil and natural gas markets. History books discussing Saudi Arabia in the middle of the last century devote most of their attention to oil industry developments. On the other hand, when people think of shale producers, they often think of “value destruction.” Instead of focusing on “value destruction,” commentators should emphasize the importance represented by unlocking the US oil and gas shales. In just ten years, oil companies brought online the equivalent of two Saudi Arabias in the same country. An incredible achievement, and yet today, the shales are primarily mentioned in the context of E&P company value destruction and climate degradation.
Shale development had many consequences, including massively shifting the US current account deficit and reducing the geopolitical influence of foreign oil-producing countries.
In 1973, President Nixon announced “Project Independence,” an attempt to make the United States an energy exporter. For the next 35 years, the United States went in the wrong direction—importing more and more oil and gas. However, by the end of the 2010s, the US had finally become a net energy exporter, thanks to the shales.
Surging shale production also allowed many investors and analysts to forget about the energy challenges society had faced in years past. For example, in the early 2000s, investors were fixated on “running out of oil.” The rise of Chinese energy demand was running into a period of lackluster non-OPEC production growth, resulting in surging prices and widespread fear. Oil ran from $25 to a record $145 per barrel in just five years.
Amid such widespread concern, several theories surrounding resource depletion and energy economics took hold. Once shale production began to surge, most of these theories – which investors had taken seriously only a few years prior – were discarded and openly mocked.
In recent years, Goehring & Rozencwajg has become convinced that shale production growth will slow and eventually turn negative. So far, the data has confirmed our thesis. If current trends continue and the shales do indeed plateau and roll over, global oil markets will have lost their only source of growth. Many of the resource depletion theories of the 2000s will likely return as critical issues in the 2020s. Investors would be wise to study them now.
The first theory we revived in 2018 was energy return on investment (EROI). Professor Charles Hall of the University of Syracuse first developed the concept in the 1980s. His work focused on studying how much energy was required to produce usable work. Professor Hall’s work was prevalent last decade as oil companies struggled to replace reserves and grow supply. The industry was forced into developing fields that required more and more energy (either oil sands or deep water offshore) for the same production level. Hall and others argued that ever-lower EROI would eventually impact economic growth. This thesis went from popular to ridiculed as soon as the shales ushered in a period of intense production growth. We found Professor Hall’s work on EROI extremely important and used it to assess the poor efficiency of renewable energy.
The next theory we would like to revisit is Peak Oil. Ironically, today many analysts refer to peak oil demand, but originally peak oil referred to supply. The theory is associated with M. King Hubbert, a controversial Shell geologist from the 1950s and 1960s. Hubbert believed that an oil field production curve would resemble a bell-shaped curve under ideal unconstrained circumstances. Production would grow at an accelerating rate, then level off, plateau, and ultimately decline at a rate mimicking its growth phase. Hubbert also developed techniques known as “linearization” to estimate a field’s total recoverable reserves. He believed that production would peak when half its reserves had been produced. At the Society of Petroleum Engineers meeting in 1956, Hubbert used his theories to predict that US crude production would peak in the 1970s at around 10 mm b/d. Hubbert made two predictions in his 1956 speech: one, assuming 150 bb barrels of recoverable oil, the other based on 200 bn barrels. In 1962, he repeated his 200 bn barrel projection, which implied production would peak at 10 mm b/d in the early 1970s. His presentation was shocking: US production had grown steadily over the previous years. When US supply did indeed peak in 1970 at 10 mm b/d, Hubbert’s work gained widespread attention.
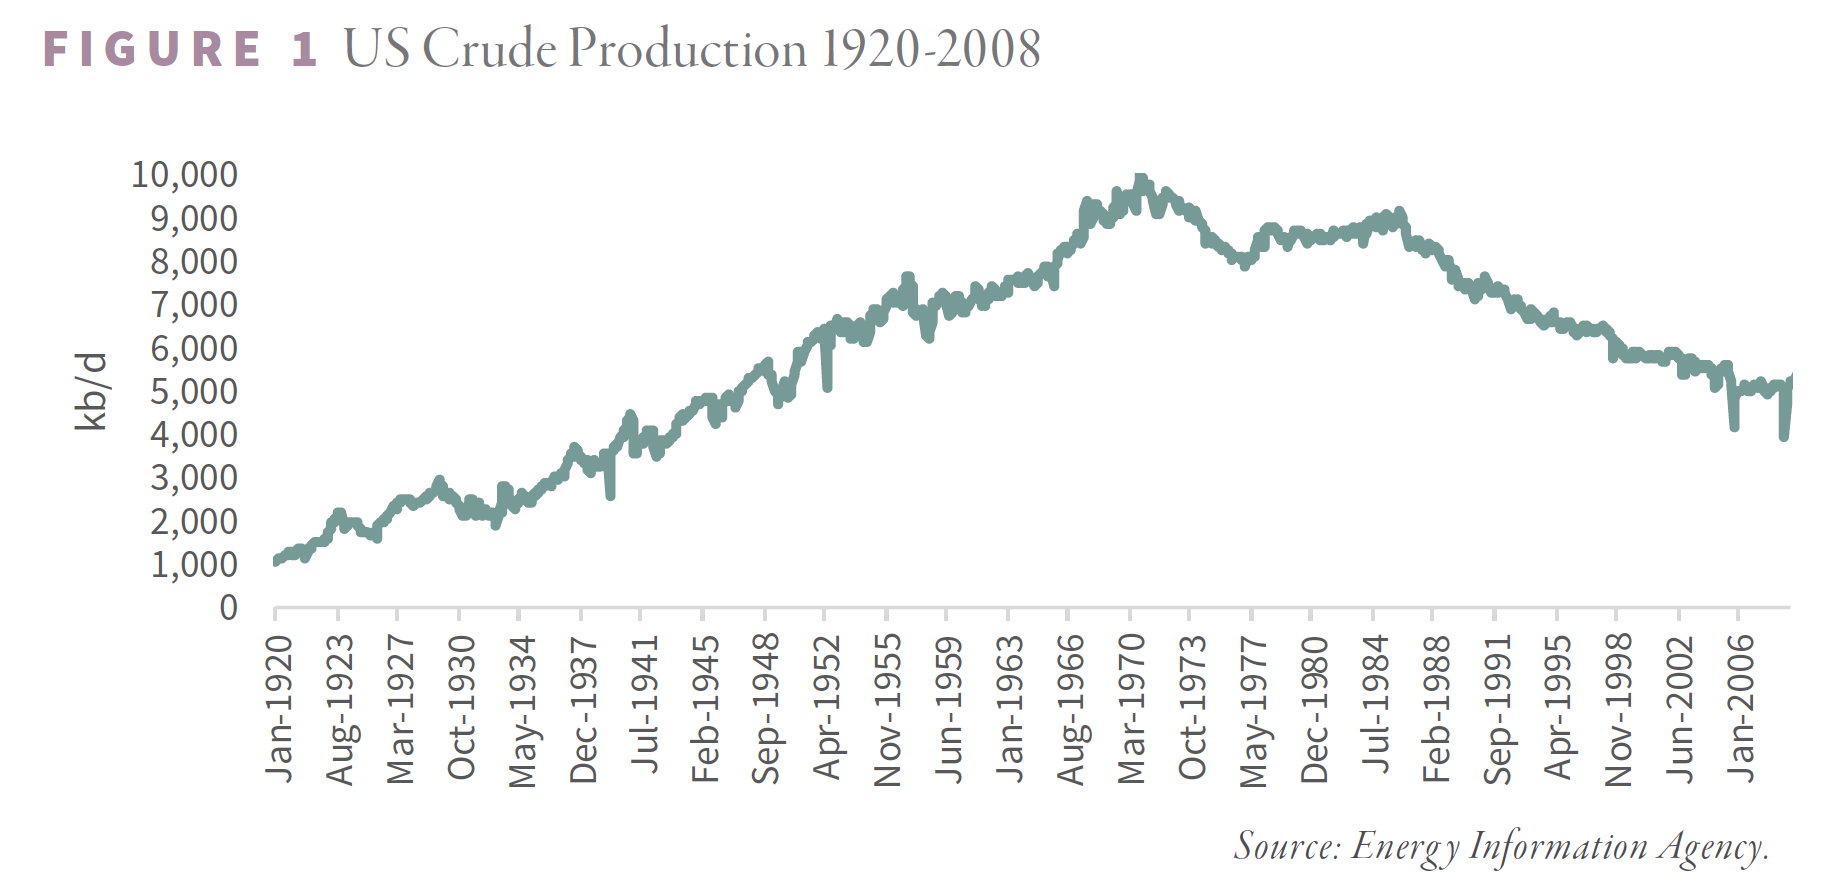
Between 1970 and 2008, US production fell steadily. By the 2000s, most people saw oil as a scarce resource and believed society should treat it dearly.
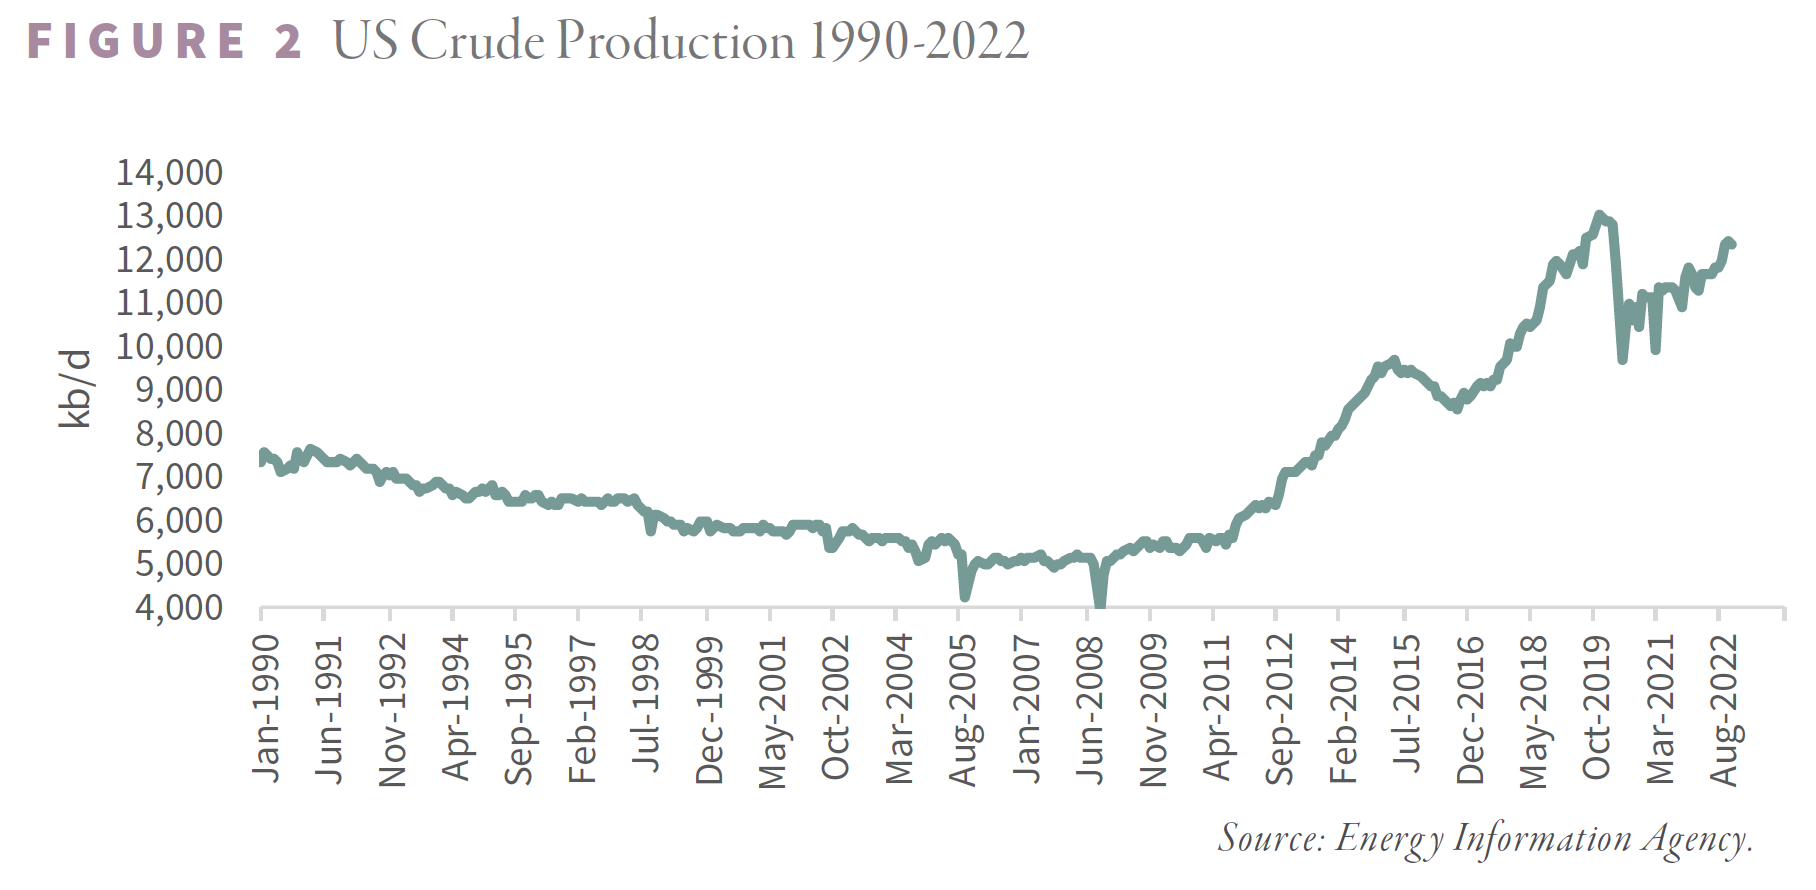
The development of shale oil spelled the end of public interest in Peak Oil. Like Professor Hall, many openly dismissed and even ridiculed Hubbert’s work., US production bottomed at 4 mm b/d in 2008 and, driven entirely by the shales, has grown since to become the largest oil producer in the world.
Given surging production over the past decade, it is easy to understand why EROI and Peak Oil have been thrown aside and labeled “blown calls.” However, we think it is completely irresponsible to dismiss them entirely. There are valuable insights in both theories; those investors that ignore them, do so at their own risk. In the case of EROI, a proper understanding of the framework predicted the disastrous impacts of renewable energy we all face today. In the case of Peak Oil, we would argue that shale trends have completely obfuscated trends in the rest of the world.
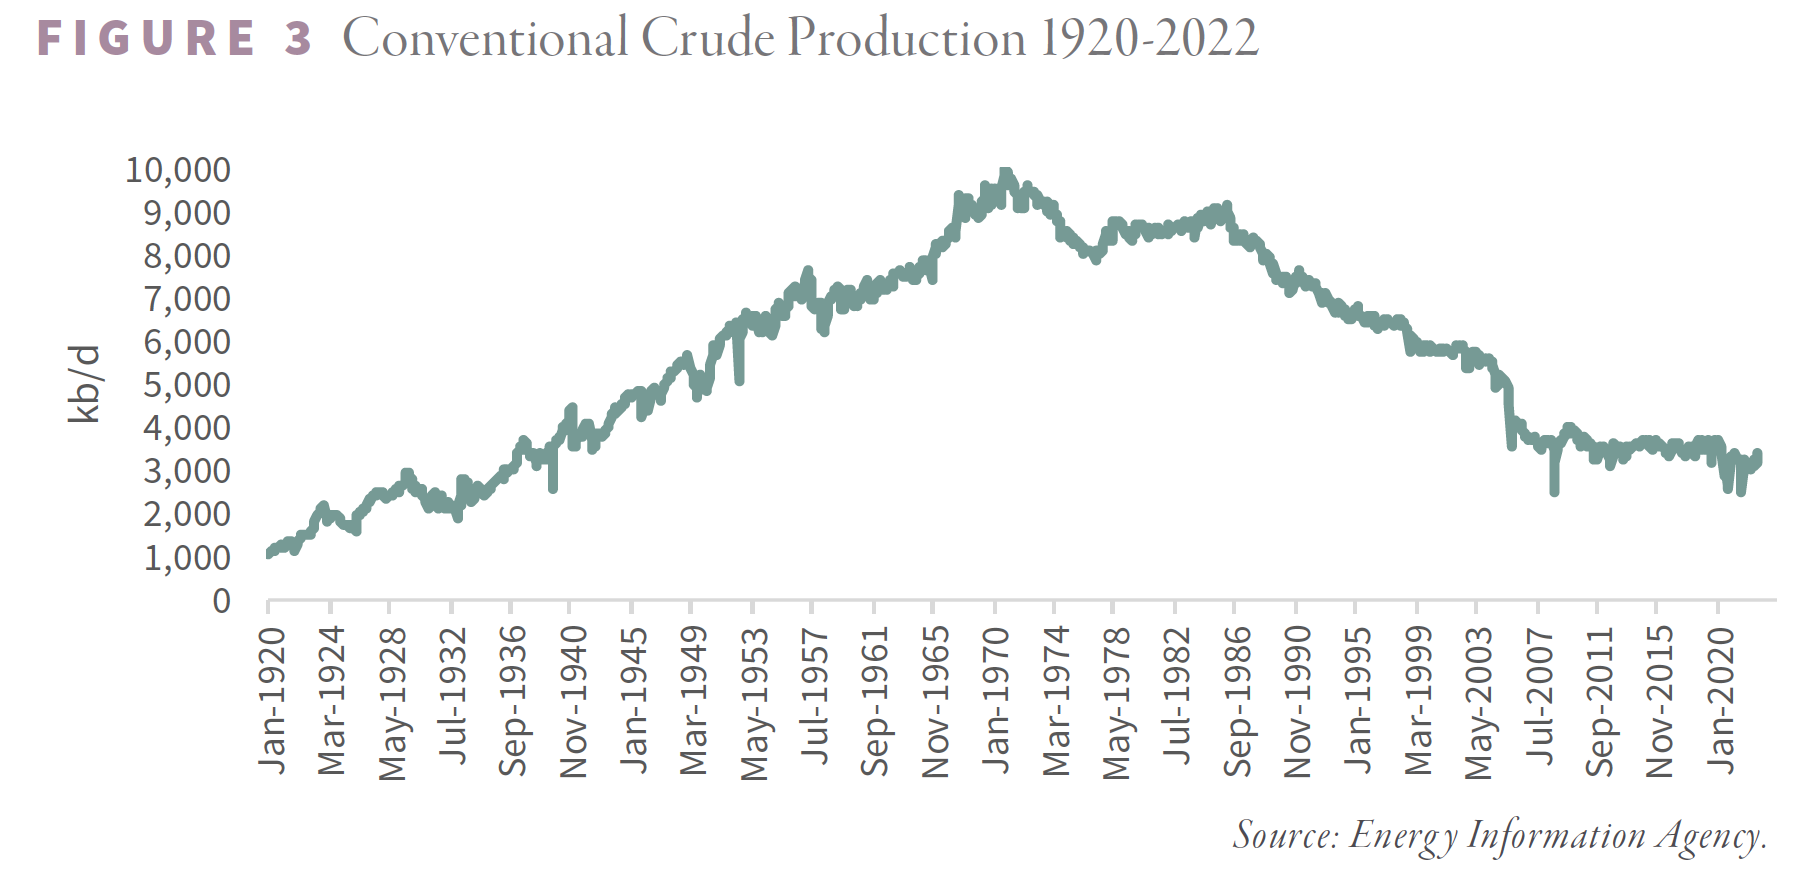
While Hubbert’s predictions look ridiculous when considering total US liquids production, focusing only on conventional crude production suggests Peak Oil is alive and well. Last year, the US produced 3 m b/d of conventional crude oil – 7 m b/d or 70% below the peak reached 52 years ago. In other words, the shales bailed out total US production but did nothing to change the forces underpinning Peak Oil and depletion. On a global basis, conventional oil production (total production ex shale and Canadian oil sands) has exhibited no growth in 17 years.
We agree with critics who argue that Peak Oil neglects the impact of new technologies that improve oil recovery. Shale development itself would fall into this category. However, it is equally imprudent to implicitly suggest the dramatic shale growth of the 2010s will continue forever and neglect the underlying forces of depletion and Peak Oil entirely. In the case of EROI, it regained relevance once we applied the framework to another energy source (renewables). In the case of Peak Oil, we believe Hubbert’s theories will regain relevance once shale production rolls over and the underlying depletion problems of conventional oil are exposed. Our models tell us that the inflection point may be quickly approaching.
In 2019, we announced the results of some very original research regarding shale drilling productivity. We wanted to understand better why wells in the Big Three basins (Eagle Ford, Bakken, and Permian) were producing more and more oil. Between 2014 and 2018, the average well in the Eagle Ford, Bakken, and Permian grew by 50, 20, and 100%, respectively. Given such high levels of productivity, the industry was able to grow shale production by 1.6 m b/d in 2018.
The conventional wisdom at the time attributed the increased productivity to better drilling and completion performance. In other words, the industry was getting better at drilling shale wells. We built an artificial neural network to help us better understand all the underlying forces that could impact shale gas drilling and production. Our artificial intelligence engine confidently told us what inputs were driving drilling productivity improvement. Drilling location was the most significant factor influencing drilling productivity, not how companies drilled the wells.
E&P companies successfully determined over time the “sweet spots” of the basins, where attributes such as thermal maturity, thickness, permeability, porosity, and organic content were ideal. In 2014, we estimate 45% of all drilling occurred within Tier 1 areas, whereas by 2018, it had surged to over 65%. If the industry were getting better at drilling wells, then previously low-productivity drilling locations would be converted into high-productivity locations, allowing production to continue to surge. Instead, we determined the industry was “high-grading” or drilling its best wells first. Our neural network told us that companies were drilling their best top-tier locations in all their basins. If our neural network was correct, we argued in 2019 that per well productivity would peak and begin to fall as tier 1 prospects dwindled, leaving the industry to either drill many less productive wells or, if not, see their production decline.
Simply put, we concluded the shales suffered from a depletion problem. Our conclusion was highly controversial at the time. Given the shale’s prodigious production growth, almost everyone believed they were limitless. Analysts talked about chronic oversupply without once thinking about the underlying geological constraints. Although the shales are extremely large, we determined they behaved precisely like traditional (albeit enormous) fields. We concluded that shale basins exhibited Hubbert-style production profiles: they ramped up, plateaued, peaked, and declined. The two earliest shale basins, the Barnett and Fayetteville, peaked between 2011 and 2014 and have both since declined by 70%.
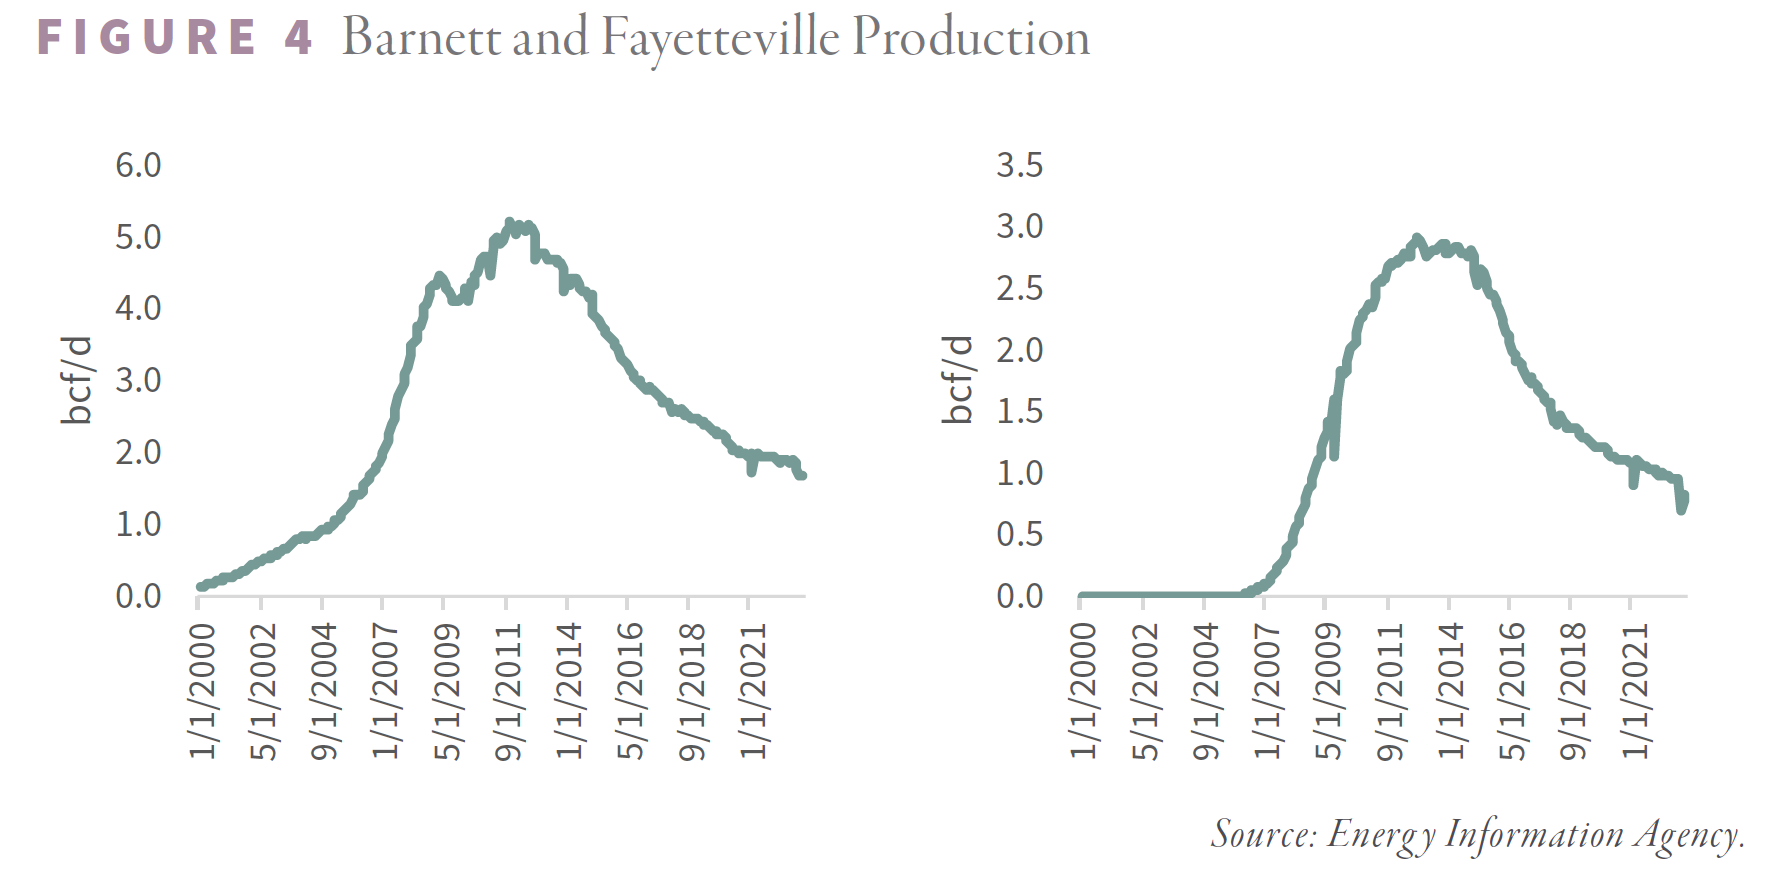
Both of these early shale basins were gas fields, but our understanding suggested to us that shale oil fields would behave similarly. Looking at the Barnett and Fayetteville, we observed that production stopped growing once half of all the best wells were drilled and began to fall sharply once Tier 1 development reached 65%.
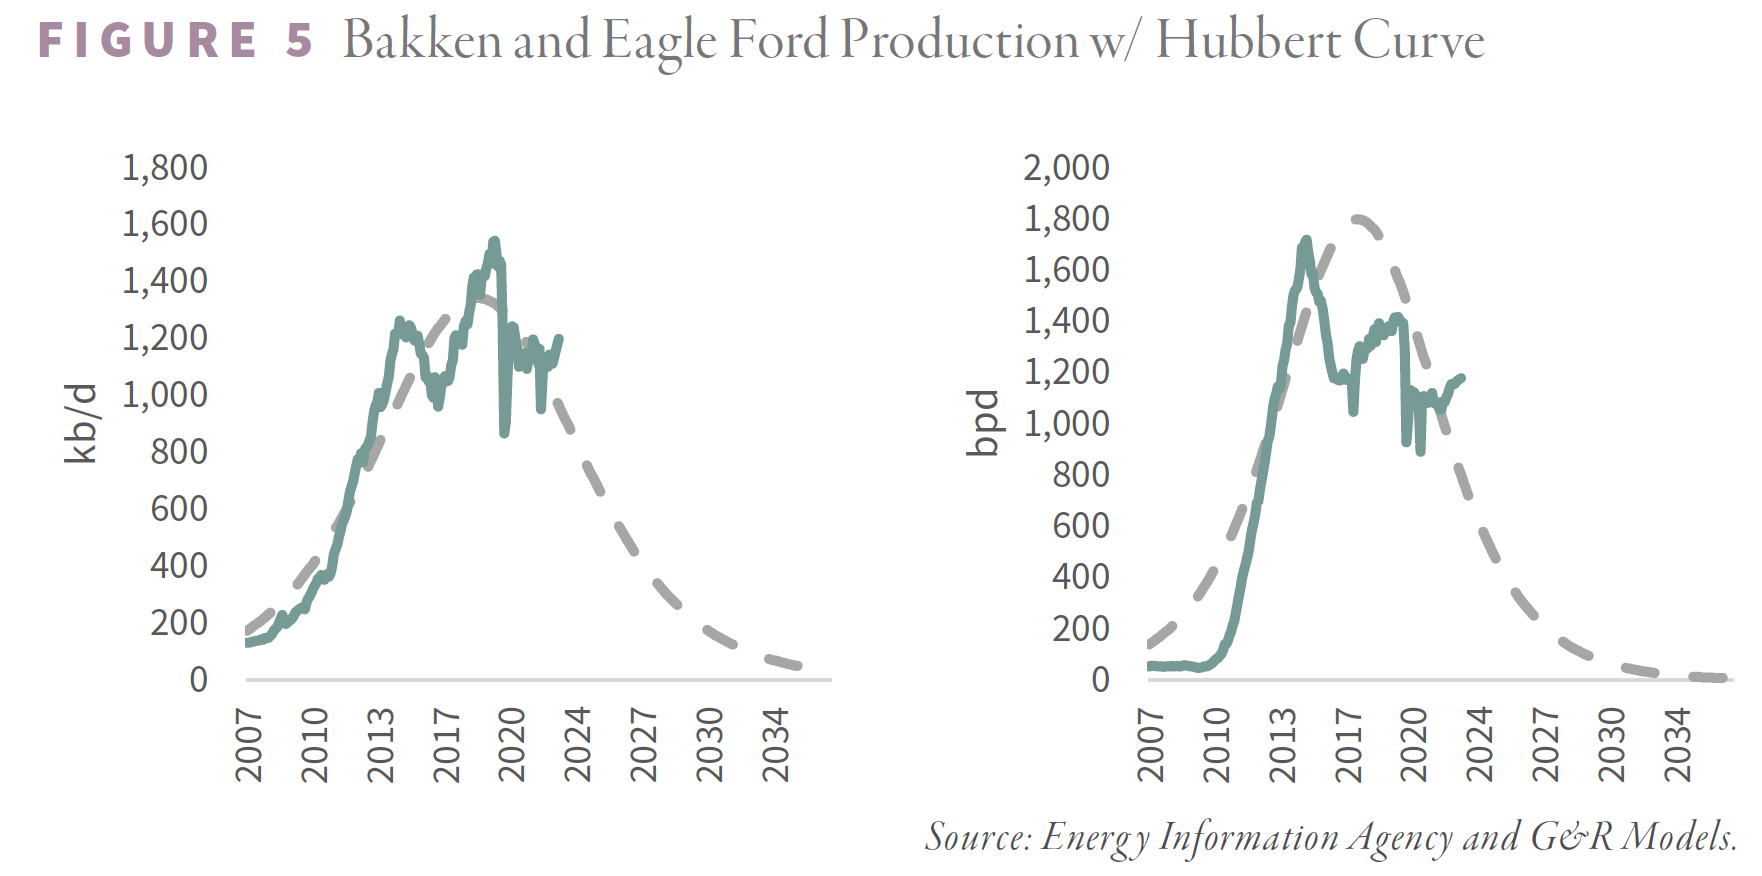
Looking at the Bakken and Eagle Ford, we concluded in 2019 that both fields had likely reached maximum production and would undergo a consistent decline. Our neural network determined that Tier 1 development reached 55% and 50% by late 2019 in the Eagle Ford and Bakken, respectively. Almost immediately after we published our findings, COVID resulted in widespread shut-ins of producing wells and a drilling decline of 70%, making our predictions impossible to verify.
With COVID impacts now behind us, and after two years where oil averaged $81 per barrel, we can assess our results. Exactly as we expected, neither Bakken nor the Eagle Ford has been able to grow. Since the end of 2019, combined production from both basins fell by 500,000 b/d. Even an increase in drilling activity has had little impact. Since the end of 2020, completions in both plays have grown by 50%, yet production over that time has been flat. The explanation is well productivity, which has fallen by 10-20% since making its high in 2019. Our neural network was correct – the Eagle and Bakken were suffering depletion and running out of high-quality inventory. As you can see in the two charts below, both the Eagle Ford and the Bakken are tracing out near-perfect Hubbert Curves. In our following letter, we will discuss the forces that are working at producing these curves in both fields and how these same forces are firmly at work in the Permian today.
In our 1Q19 letter, we explained how the Permian still had room to grow. We estimated that Permian production would peak at 6.5 m b/d – 900,000 b/d above current levels. Compared with the Bakken and Eagle Ford at nearly 50% Tier 1 development, we estimated the Permian still had 65% of its Tier 1 wells left to drill. According to our estimates, the Permian would reach maximum production sometime in 2024-2025 and then begin to peak and decline like the other two basins. Again, our models were correct. Unlike the Bakken and Eagle Ford, the Permian grew by 800,000 b/d since the end of 2019 and by 1.2 m b/d since 2020. Production fell during COVID but quickly rebounded and surpassed the old highs.
Interestingly, the Permian has been the only basin to grow drilling activity since the end of 2019. In the Bakken and Eagle Ford, activity remains 10% below pre-COVID levels, whereas, in the Permian, activity is 5% above late-2019 levels. The answer is the superior inventory of remaining Tier 1 locations.
Unfortunately, this superior inventory is being drawn down. We estimate that closer to 45% of all Tier 1 Permian locations have been drilled. The Permian is quickly approaching the same level of development as the Bakken and Eagle Ford in 2019. Our models tell us the results will be similar: Permian production will peak, plateau, and decline much sooner than anyone expects.
Since building our first neural network, we have dramatically improved model design and data quality. Our original model used longitude and latitude to help predict productivity. We now have access to subsurface geological data, such as thickness, thermal maturity, clay content, organic content, permeability, and porosity. Of course, we also have three additional years of data since we first published the results of our original model.
In our following letter, we will detail the results of our work. The early results confirm our intuition: we have mostly drilled out our best areas in the Permian, and once Permian production declines begin, shale growth will be difficult, if not impossible, to achieve from there.
As shale growth slows, investors will be re-confronted with the concepts of depletion and Peak Oil. The development of the US shales has allowed us all to forget about these problems for over ten years. We urge investors to familiarize themselves with these topics because our models suggest they will be crucial in navigating markets in the future.
Investors and policymakers tend to fight the last war and often are blind to the changes that will impact the future. In the early 2000s, investors’ focus on Peak Oil left many unable to see shale’s transformative potential. Today, investors remain convinced the shales are endless and fail to see that depletion problems have already taken hold.
Along these lines, we want to leave you with a curious thought. On December 22, 1975 – three years after OPEC stopped shipments to the West, ushering in the first oil crisis -- President Ford signed a bill that limited US crude exports. Ford announced the bill would pave the way towards energy independence – something few believed possible. Only five years after signing, oil prices peaked at $35 per barrel and spent the next 18 years falling 70%. Ford was fighting the last war and neglected to appreciate the new oil development in Alaska, the Gulf of Mexico, and the North Sea. Ford’s law was repealed in 2015, allowing US crude exports for the first time in forty years. Lawmakers argued the legislation was outdated, given the massive surge in domestic production. They argued that the US was no longer at risk of embargoes; energy independence was imminent. Ford’s predictions took five years to begin being proven incorrect. COVID likely delayed “peak shale” by a few years due to slower drilling activity. However, our models suggest that eight years after repealing the ban, the idea of abundant US energy has also been proven incorrect. We believe the result will be much higher oil prices from now on. We predict new interest in Hubbert’s theories. Investors should familiarize themselves and be prepared for the potential arrival of Hubbert’s Peak. The economic dislocations and investment opportunities will be massive.
Intrigued? We invite you to revisit our entire Q4 2022 research letter, available below.
Registration with the SEC should not be construed as an endorsement or an indicator of investment skill, acumen or experience. Investments in securities are not insured, protected or guaranteed and may result in loss of income and/or principal. Historical performance is not indicative of any specific investment or future results. Investment process, strategies, philosophies, portfolio composition and allocations, security selection criteria and other parameters are current as of the date indicated and are subject to change without prior notice. This communication is distributed for informational purposes, and it is not to be construed as an offer, solicitation, recommendation, or endorsement of any particular security, products, or services. Nothing in this communication is intended to be or should be construed as individualized investment advice. All content is of a general nature and solely for educational, informational and illustrative purposes. This communication may include opinions and forward-looking statements. All statements other than statements of historical fact are opinions and/or forward-looking statements (including words such as “believe,” “estimate,” “anticipate,” “may,” “will,” “should,” and “expect”). Although we believe that the beliefs and expectations reflected in such forward-looking statements are reasonable, we can give no assurance that such beliefs and expectations will prove to be correct. Various factors could cause actual results or performance to differ materially from those discussed in such forward-looking statements. All expressions of opinion are subject to change. You are cautioned not to place undue reliance on these forward-looking statements. Any dated information is published as of its date only. Dated and forward-looking statements speak only as of the date on which they are made. We undertake no obligation to update publicly or revise any dated or forward-looking statements. Any references to outside data, opinions or content are listed for informational purposes only and have not been independently verified for accuracy by the Adviser. Third-party views, opinions or forecasts do not necessarily reflect those of the Adviser or its employees. Unless stated otherwise, any mention of specific securities or investments is for illustrative purposes only. Adviser’s clients may or may not hold the securities discussed in their portfolios. Adviser makes no representations that any of the securities discussed have been or will be profitable. Indices are not available for direct investment. Their performance does not reflect the expenses associated with the management of an actual portfolio.