A sudden and unexpected event is about to take place: the global natural gas crisis, now gripping large swaths of the world, is about to engulf North America as well.
Asian and European natural gas prices today stand at $30 per mcf versus $7.50 per mcf here in the United States. Given the underlying fundamentals that have now developed in US gas markets, we believe prices are about to surge and converge with international prices within the next 6 months. The convergence of US and international gas prices will come out of nowhere and take all investors by surprise.
Global natural gas markets have been in a full blown crisis since summer 2021. Gas prices reached a record breaking $35 per mmbtu last October, and by December they had surged again, this time surpassing $50 per mcf -- approximately $300 per barrel in oil terms. Evidence of the global natural gas crisis appeared first in Europe early last spring as a colder than normal late winter left natural gas inventories in both Europe and Russia near record low levels. Once additional Russian supplies failed to emerge, European utilities and industrial gas consumers by mid-summer had aggressively entered global LNG markets seeking additional supplies. Consensus opinion believed that Russia withheld contracted gas over the spring and summer; however our analysis tell us that Russia honored all its previous agreed-upon supply agreements. Additional gas above contracted levels were withheld as Russia attempted to first refill its own depleted inventories.
Surging global LNG demand –a subject we have extensively discussed in our quarterly letters—meant that little excess spot LNG supply was available to European buyers last summer. As European buyers aggressively entered spot markets and then panicked, natural gas prices began its 5-fold surge.
Gas prices have already severely impacted the European economy. Fertilizer and smelter facilities have been forced to close, governments are offering cash subsidies to soften the blow of surging natural gas and electricity prices, and coal demand has hit all-times, undoing a decade of effort to reduce to CO2 emissions. All this occurred before Russia’s invasion of the Ukraine.
The upheavals now rocking global gas markets have largely by-passed North America over the last 12 months. US natural gas prices had a big rally last year. Gas prices surpassed briefly the $6 per mmbtu level back in September, but by mid-December, with European gas prices surging past $50, US gas price had fallen back to $4.00—a discount of almost 90% to the global price. Today the natural gas crisis gripping huge swaths of the natural gas world shows little inclination of moving across either Pacific or Atlantic oceans. The crisis seems very far away and is of little investment interest. “Gas-crisis… what gas crisis?” might be something North American investors ask themselves today.
The unique structure of the gas market here in North America has long protected it from foreign influences. Since its development, evolvement, and massive expansion in the post WW2 period, the US natural gas market has been structured like an island. Natural gas could be produced in the United States, imported from Canada, and LNG could be imported from any of its 5 import terminals. However, once that gas arrived it was trapped. Small amounts could be exported via pipeline to Mexico, but that was it. No lower-48 facilities to export LNG existed. Because of its island-like structure, international gas fundamentals could produce only small impacts on US natural gas prices. Global natural gas prices could go as high was they wanted, but with no export capability, US gas often traded at huge discounts -- today’s huge price discounts being an extreme example.
Prior to 2016, the US was only a tiny player in global LNG export markets—a small amount was exported form the Kenai Peninsula in Alaska. However, in just six short years, the US today has become the world’s largest LNG exporter. Six export facilities are currently in operation, and a seventh, Calcasieu Pass, will add an additional 1.7 bcf per day of capacity, bringing total US LNG export capacity to almost 13 bcf /day, surpassing both Qatar and Australia, the world’s two largest LNG exporters.
Even though US natural gas markets are now fully integrated in the global gas market, the surge in export capacity has had little impact on US natural gas prices. The reason: the US natural gas remains in structural oversupply as production has continued to grow faster than demand driven the shale gas revolution.
The impact of the shale gas revolution here in the United States cannot be overstated. Although it is hard to believe, prior to the unlocking of the Barnett Field in east Texas in the early 2000’s, the US was running out of natural gas. In 2000, US conventional natural gas production was approximately 50 bcf per day. By 2005 this had fallen to 45 bcf per day, and by 2010 US conventional production had fallen to just 40 bcf per day. Even with the big shale gas ramp up from the Barnett, total us gas production in the US fell from 52.6 bcf per day in 2000 to 49.5 bcf per day by 2005.
Again, although it’s hard to believe, the US by the late 1990’s had become a significant importer of LNG. In 2000, the US imported approximately 600 mmcf/day; by 2005, this had grown significantly reaching almost 1.8 bcf/day; and by 2007 LNG imports peaked at 2.1 bcf /day.
The contrast between the two periods -- 2000-2007, and 2016-2021 -- are amazing. Between 2000 and 2007 natural gas production was falling and LNG imports were surging. Today, US natural gas production has surged over the last 7 years, and the US has become the world’s biggest LNG exporter. Talk about a difference.
The Barnett Shale began its big production ramp-up in 2002, and this was followed by unlocking of the Fayetteville shale in 2005. The Marcellus and Haynesville began their big production ramps in the late 2000’s, and these were joint by the associated natural gas production from the Bakken, Eagle Ford, DJ, Permian, and Anadarko oil shales. Finally, the Utica shale in Ohio began its big production ramp up in the mid 2010’s.
In 2000, US dry gas production was 52.6 bcf per day, and the shales represented little. Today US dry gas production has reached 94 bcf per day, and the shales represent almost 80%, or an incredible 73 bcf per day of production.
The table below ranks the largest US producers of shale gas.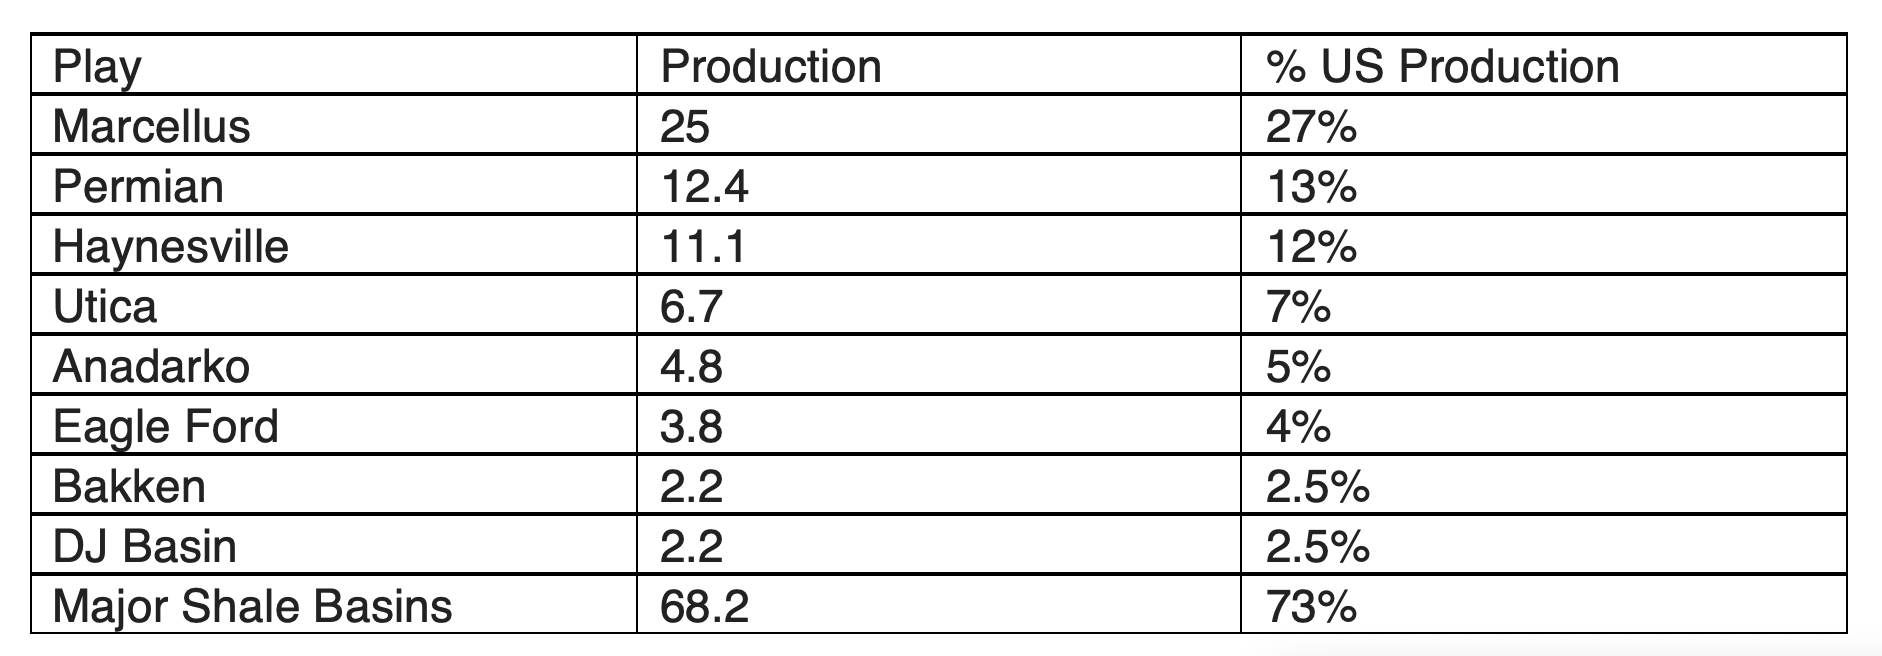
Between 2016 and today, US natural gas production has grown by over 20 bcf/day (the US gas shales grew by incredible 27 bcf/day) which has far outstripped the 10 bcf in LNG demand growth. Reflecting the huge surplus of supply over demand the ratio of natural gas prices to oil prices averaged 20 for those six years -- the BTU equivalent ratio should be 6.
Between 1998 and 2006 the ratio of oil prices to gas prices traded with an average ratio of 7.9--not too far from its BTU equivalent. Since 2013 however, the ratio has “blown-out” and has averaged 20—a ratio that still exists today. Now compare that to international natural gas prices, which trade at a ratio of three. A BTU contained in a barrel of oil today costs you approximately $18. That same BTU contained in a US mcf of gas now costs you $5.50 (and 70% discount to the BTU’s contained in a barrel of oil), compared with Europe and Asia who are now paying almost $35 for that same BTU—a 100% premium to the BTU’s contained in an oil barrel. In our 35 years of investing in global energy markets, we have never seen such a wide dispersion on how BTU’s are priced between various energy sources.
Over the last 15 years, driven by the shale gas revolution, US production has grown by an incredible 85%. In the last six years alone, gas supply has surged 60%. Today, almost everyone believes US gas supply can continue to grow strongly as we progress through this decade. Little analysis is being done by anyone on supply issues, or how long the shale gas revolution has left to run. Also something else has happened that receives no comment: never has before has natural gas production been concentrated in so few fields. Over 50% of US gas supply comes from just three fields. The Marcellus and Hayneville shale gas fields today produce almost 40% US gas supply. Adding the associated gas from the Permian oil shale takes this to 52%.
As we will discuss extensively in our upcoming quarterly letter, we believe that the tremendous growth in US natural gas supply, all shale driven, is about to slow dramatically. Both the Marcellus and the Hayneville shale gas play are in the process of plateauing and will begin to exhibit declines in the next several years according to our analysis. These two fields alone represent almost 40% of US supply, and the production growth from these two fields are critical for fulfilling future increase in US natural gas demand.
Given their importance to US gas market and given that the Biden Administration has pledged Europe another 5 bcf per day in US LNG supply by 2030, you would think that serious analysis would be paid to figuring out the future production profiles of these two fields, and how their future production profiles will impact both future US natural gas supply and prices.
Given that the US natural gas market is now world largest LNG exporter, and now fully integrated in the global gas markets, we believe it’s imperative to understand the what their future production profiles of these who fields might look like.
Many analysts believe that production growth from these two fields are almost unlimited. Our analysis tell us something quite different. We believe both fields will begin to exhibit the first signs of field exhaustion -- very similar to what happened with the Barnett and Fayetteville.
By understanding the forces that caused production from the Barnett and Fayetteville fields to peak, plateau, and then decline, we can try and understand when the Marcellus and Haynesville might roll over. Although the shales are an “unconventional” source gas, our analysis tells us they exhibit characteristics similar to conventional oil and gas reservoirs: they ramp up, plateau, and begin to decline after half the recoverable resources are produced. The Barnett and Fayetteville shale gas fields plateaued and began their sharp declines just after half their recoverable reserves were produced, and our analysis tells us this is about to occur in both the Marcellus and Haynesville fields very soon.
Unanticipated slower US natural gas supply growth will swing the US natural gas market from “structural surplus”, a condition that has now existed for well over 15 years, to “structural deficit”. Almost immediately following the shift, US natural gas prices will surge and converge with global gas prices. Given today’s $35 per mcf international gas price, US natural gas could surge by almost 5 fold.
The global natural gas crisis has largely by-passed the United States over the last 12 months, however, our analysis tells us that this is about to change. The next phase of the global energy crisis is about to emerge in the US natural gas market. Given the huge amount of natural gas consumed in the US economy –14 mmb/d (in oil equivalent terms ) versus 20 mm b/d in oil—the impact from surging natural gas prices will be monumental.
In our upcoming letter (Q1 2022), we will present the research that strongly suggests that the convergence of US natural gas markets with global gas markets will occur at some point in 2022. The surge in US natural gas prices will come out of nowhere and take everyone by surprise. If you haven't already signed up to be notified when we release our letters, please subscribe below.