
The article below is an excerpt from our Q1 2025 commentary.
“Platinum Breaking Out on Surging Demand From China”
~Bloomberg, May 20th, 2025
“BMW bets on petrol and sees rocky road to electrification… BMW has pledged to continue investing in combustion and hybrid technologies.”
~Financial Times, February 11, 2025
“South African miner Impala Platinum may close its Canadian palladium mine earlier than planned after prices for the metal used in gasoline vehicles have plummeted more 70% over the last three years.”
~The Northern Miner, February 27, 2025
The time has come, we believe, to turn serious attention—and capital—towards the platinum group metals and their related equities. Over the past 18 months, a growing number of supply and demand signals have begun to flash in concert, suggesting that a long-overlooked corner of the commodity world may be on the cusp of making a significant bullish move. We say this with some sense of historical symmetry. It has been a long while since we last held meaningful positions in the global PGM markets. In fact, one has to rewind the tape all the way back to the late 1990s and early 2000s to find us actively invested in the sector. For the curious (and the nostalgic), we’ve included a Barron’s commodity column of ours dated January 15, 2000—in retrospect in was a great call.
The late ’90s, of course, offered a classic setup: an obscure group of metals largely dismissed by the broader investment community, and a handful of public equities priced for irrelevance. It was precisely then that the opportunity proved greatest. Between their lows in the late 1990s and their highs just before the 2008 financial crisis, shares of South Africa’s Rustenburg Platinum (now Anglo American Platinum) and Impala Platinum staged extraordinary bullish moves—rising, in dollar terms, by a factor of 30 and 60, respectively.
Today, we believe investors are once again being offered an opportunity that bears more than a passing resemblance to that earlier moment—one that, in time, could prove every bit as spectacular.
The bear market in platinum, now in its sixteenth year, has become a study in endurance. Palladium, for its part, has spent nearly four years in decline. Sentiment is bleak. The prevailing narrative—repeated with the assurance of conventional wisdom—holds that electric vehicles will permanently erode demand for platinum group metals. It’s a tidy story, but one that, we would argue, has already begun to unravel.
In our view, today’s deficit conditions in both platinum and palladium are not only real— they’re likely to persist far longer than the market currently expects. Demand has held up with surprising resilience. Supply, from both mined and recycled sources, continues to disappoint. And most importantly, investment demand—a vital swing factor in the platinum market—is beginning to re-emerge.
As for the equities, they’ve absorbed every bit of the bearish mood. Since peaking just three years ago, the major PGM producers have fallen nearly 80%. They are, to put it plainly, priced for despair. But if we are right—if PGM prices are indeed poised to move materially higher— then these companies, trading at valuations last seen in the depths of previous cycles, may once again offer the kind of extraordinary returns we witnessed a quarter-century ago. The time to act, we believe, is now.
What, then, makes us so bullish?
There are three key reasons why we think the bear market in PGMs is drawing to a close— each of which we’ll explore in the sections that follow.
Demand Shifts: A Turning Tide for PGM Consumption
Shifts in demand are now well underway that may prove enormously consequential for platinum group metals. Roughly 65% of global platinum, palladium, and rhodium production flows into automotive catalytic converters. And yet, in recent years, investor sentiment has turned uniformly bearish on this critical source of demand. The prevailing thesis, repeated almost ritualistically, holds that the rise of electric vehicles (EVs) will render PGMs increasingly obsolete.
That thesis, we believe, is unravelling as we write.
Recent disappointments in global EV sales have already begun to chip away at the most aggressive adoption forecasts. Where once a straight line was drawn between the present and a fully electrified automotive future, industry analysts are now beginning to consider a more nuanced scenario—one in which internal combustion engine (ICE) vehicles maintain measurable growth well into the 2030s. That, needless to say, would represent a profoundly constructive development for PGM demand.
Our readers will recognize the view. We have long been critical—some might say heretical— about the consensus on EV penetration. The narrative, while tidy, never quite aligned with the data. The recent string of missed sales targets has only deepened our conviction. What was once a minority view—grounded in thorough research—is increasingly difficult to dismiss.
Consider the numbers: global ICE vehicle sales peaked in the late 2010s at 95 million units, fell as low as 75 million during the pandemic years, and have since rebounded to an annualized rate nearing 90 million. Even granting the assumption—borrowed from the excellent work of Rob West at Thunder Said Energy—that EV sales grow from 14 million units in 2023 (a 15% market share) to 40 million by 2030 (30% share), total ICE vehicle sales could still hold steady near 90 million through at least 2033.
That’s the conservative case. Should EV adoption stumble further, as we believe it might, the upside for PGM demand is even greater.
But there is another, less-discussed trend that may ultimately prove just as important: the rise of the hybrid vehicle. While we remain skeptical of EV economics and utility, we have become increasingly bullish on hybrids—and for a simple reason. Our analysis suggests hybrids offer superior energy efficiency to both EVs and traditional ICE vehicles. If correct, this efficiency advantage could drive widespread adoption, with implications that are deeply positive for PGM markets.
Hybrids have been curiously underexamined by investors and analysts alike. That is a gap we intend to address in this essay. Understanding the true energy economics of hybrid drivetrains is not just an academic exercise—it is key to understanding how PGM demand may evolve in the coming decade.
Why? Because hybrids require more PGMs than ICEs. Catalytic converters operate best at high temperatures. In a traditional ICE vehicle, the engine runs continuously, allowing the converter to reach and maintain those optimal temperatures. In a hybrid, the engine cycles on and off, which causes the catalytic converter to run cooler and less efficiently. To compensate, automakers must increase the loading of platinum group metals—sometimes by as much as a full additional gram per vehicle.
As hybrids gain share at the expense of both EVs and ICEs, the added PGM intensity becomes an important and underappreciated source of future demand—one that few analysts have yet chosen to highlight.
It’s a popular notion these days that electric motors are marvels of efficiency. And indeed they are—when judged on their own without comparison. But that neat superiority begins to unravel once one considers the full cost of generating electricity and the heroic energy it takes to produce the battery. In point of fact, when one begins with a theoretical 100 kilowatt-hours of primary energy, a plain internal combustion engine (ICE) car will carry its driver roughly 20 percent farther than an electric vehicle drawing its lifeblood from a natural gas-fired grid. And—this might startle the Tesla crowd—50 percent farther than a similar EV drawing its power from renewable sources.
It turns out that electric motors, for all their charms, labor under three great burdens: the prodigious energy cost of electricity production itself, the even more staggering energy required to manufacture the battery, and the not-insignificant energy necessary to drag that very battery around once it’s installed. The EV, in short, is a sleek machine weighed down by its own invisible obligations.
This, then, is the stage on which the hybrid vehicle performs its quiet little miracle.
To see why the hybrid is so effective, one must first examine how it—and its more gregarious cousin, the plug-in hybrid—goes about the business of turning energy into movement. A traditional hybrid uses a modest battery, typically just 1 to 2 kilowatt-hours in size, to assist an electric drive train. This battery is not a long-distance runner. It exists not to extend range but to lend a strong push when the car is starting from a stop—an activity at which electric motors excel and combustion engines struggle. And unlike an EV, the hybrid’s battery does not draw power from the grid. Rather, it harvests the kinetic energy typically lost during braking—via that ingenious mechanism known as regenerative braking—and stores it for the next start-up. This is not a trick; it is engineering alchemy.
The result? Efficiency gains that border on the scandalous. Where a respectable ICE vehicle might return 37 miles per gallon, the hybrid manages 58. In terms of energy, the hybrid demands just 63 kilowatt-hours per 100 miles traveled, versus 98 for its combustion cousin. And when one tallies the energy cost of battery manufacturing over the vehicle’s life, the hybrid again comes out ahead: a 2 kwh battery adds a mere 0.3 kwh per 100 miles, compared to a lumbering 14 kwh per 100 miles for the all-electric competitor. The hybrid’s battery is not only cheaper to build—it’s lighter to haul. And that matters.
All told, if one begins again with that same 100 kwh of primary energy, the hybrid will carry its occupants 56 miles: 40 percent farther than the ICE car, 65 percent farther than the EV powered by natural gas, and an astonishing 220 percent farther than an EV whose electricity comes from renewables.
Enter, now, the plug-in hybrid—the ambidextrous vehicle that straddles the line between EV and traditional hybrid. A typical plug-in hybrid (or PHEV as they are called) carries a 12 kwh battery, about one-eighth the size of a full EV’s. When burning gasoline, it behaves much like a traditional hybrid—efficient and unassuming. When in electric mode, it may offer 30 to 40 miles of pure battery range. As such, the PHEV’s overall efficiency falls somewhere in the middle. It benefits from not lugging around a battery the size of a steamer trunk, but it is still shackled to the low net energy efficiency of electricity production. Assuming a 50/50 split between electric and gasoline operation, we calculate the PHEV will achieve 50 miles per 100 kwh of primary energy—25 percent more than the ICE, but 12.5 percent less than the traditional hybrid.
Now, for the thorough: both the traditional hybrid and the plug-in hybrid demand more platinum group metals in their catalytic converters than the standard ICE car. We have, of course, accounted for this. One ought not to leave out the cost of precious metals when tallying the efficiency of modern miracles.
And so the hybrid, in either of its guises, emerges not as a compromise but as a kind of mechanical ideal—an ideal solution today’s energy world, where efficiency is not a luxury, but a necessity.
The surge in PGM demand driven by hybrids is only part of the story. A second, equally important force is now gathering momentum: the steady tightening of global vehicle emissions standards.
Today, 98% of all new vehicles sold worldwide are equipped with catalytic converters. The average PGM loading per converter is currently estimated at 5 grams. We believe that figure is heading higher—and soon.
Ultimately, total demand for platinum group metals from the auto sector hinges on two variables: how many internal combustion engine vehicles (hybrids included) are sold, and how much PGM material is used per vehicle. As we’ve already discussed, we believe that even under conservative assumptions, ICE vehicle sales will remain flat through at least 2033—a position that may seem controversial in the current narrative environment but is, in our view, well supported by data.
The second variable—PGM loadings per vehicle—is even more straightforward, and arguably more powerful. Several factors are converging that we believe will lead to steadily increasing loadings in the years ahead.
At its core, the physics is simple: the more PGMs a catalytic converter contains, the better it performs. Higher loadings yield more complete conversion of unburned hydrocarbons, carbon monoxide, and nitrogen oxides into less harmful byproducts like carbon dioxide and water vapor. And as emission standards become progressively more stringent, so too must the efficacy of the converters.
We are already seeing this dynamic play out. In markets where regulations are tightest— Europe and Japan—catalytic converters now contain between 7 and 9 grams of PGMs. In the United States, the figure averages closer to 5 grams. In China and much of the developing world, the current range is lower still, roughly 3 to 4 grams.
But that, too, is about to change. Both Europe and China are set to implement new emissions regulations between now and 2030. In Europe, the incoming EU7 standard for light-duty vehicles and the EU VII standard for heavy-duty transport are expected to require significantly higher PGM loadings. China is likewise preparing to ratchet up its regulatory framework, following a similar path.
In China, the upcoming CN7 emissions regulation is expected to mandate a significant reduction in gaseous pollutants—and with it, a sharp increase in PGM usage. The last such regulatory tightening in China came in 2021 and resulted in platinum group metal loadings rising from 2.5 grams to nearly 4 grams per vehicle. Under CN7, loadings are projected to climb further, reaching 5 grams per vehicle—bringing China into alignment with global averages.
India, meanwhile, is moving in a similar direction. The Bharat Stage 7 (BS7) emission standard is scheduled to take effect in July 2025. Intended as India’s counterpart to Europe’s emissions framework, BS7 will similarly necessitate a meaningful rise in PGM loadings across the vehicle fleet.
There is another dimension to this regulatory tightening that merits attention: the expanded use of advanced emissions-control technologies. Chief among them is turbocharging. By forcing additional air into the engine’s combustion chamber, turbocharging boosts power and efficiency—a desirable outcome. But the trade-off is greater particulate matter, which in turn requires more platinum group metals in the catalytic converter to meet emissions thresholds. Current estimates suggest that turbocharged engines require an additional 2 grams of PGMs per vehicle to manage the extra emissions.
Turbocharging, at present, is used in just half of all newly produced ICE vehicles globally. That figure seems unlikely to remain static. As emissions standards grow stricter, turbocharging penetration will almost certainly rise, and with it, the demand for PGM-intensive catalytic converters.
Taken together, these factors form a clear and strengthening trend: China and India moving toward tighter regulatory regimes, turbocharging becoming more widespread, and catalytic converter loadings rising accordingly.
Most analysts project a future for platinum group metals in which demand drifts steadily lower—an orderly decline paced by the presumed ascendancy of electric vehicles. We are not among them.
On the contrary, we believe PGM demand is far more likely to surprise to the upside in the years ahead. Long-term forecasting in this space is rare, and when attempted, often cursory. But here we again lean on the deeply detailed modelling done by Rob West at Thunder Said Energy, whose work we believe merits particular attention.
Total demand for platinum, palladium, and rhodium currently stands at 18.7 million ounces. Of that, 65% is consumed in catalytic converters, 10% in jewelry and investment applications, 9% in chemical processes and oil refining, 8% in electronics and glass, and roughly 3% in medical uses. Mr. West’s long-range forecast, incorporating the very demand vectors we’ve been discussing throughout this essay, calls for total PGM demand to rise to nearly 23 million ounces by 2032—a 23% increase from current levels.
Importantly, that forecast includes what we view as overly optimistic assumptions for EV adoption. Given our far more conservative view of EV penetration, we suspect Mr. West’s projection could ultimately prove understated.
It is also worth noting what his forecast does not include: any contribution from hydrogen-powered vehicles. There is a contingent of analysts who believe hydrogen fuel cells will eventually displace a meaningful portion of both light- and heavy-duty vehicle fleets. We are not among them either.
Though we have not yet written in detail on the subject, our internal calculations suggest that hydrogen-powered vehicles suffer from a critical flaw: poor energy efficiency. Much like battery EVs, hydrogen fuel cells struggle to compete with the internal combustion engine, and even more so with hybrids, which we believe offer the most compelling efficiency profile of any drivetrain currently available.
That said, if we are wrong—and hydrogen-powered vehicles were ever to achieve substantial market share—it would represent a major boon for PGM demand. While our analysis suggests this is unlikely, PGMs represent a free call option on hydrogen penetration, and we are never above taking on a free call option.
Investor sentiment toward the platinum group metals has turned sharply negative, driven in large part by a prevailing assumption that demand is destined to decline. As we’ve outlined in the preceding pages, we believe this view is not only overly pessimistic—it is fundamentally flawed. The market, in our judgment, has significantly underestimated the likely trajectory of PGM demand between now and the early years of the next decade.
Supply-demand trends have turned extremely positive.
Both the platinum and palladium markets have now swung into deficit—and by all indications, those deficits are only going to get worse. After recording a 750,000-ounce shortfall in 2023 and a 680,000-ounce deficit in 2024—figures that represent nearly 9% of total global demand—the platinum market is now on track for a third consecutive year of undersupply. According to estimates from the World Platinum Investment Council, the 2025 deficit will approximate 500,000 ounces.
Three factors are principally at work here. First, mine supply out of South Africa has contracted by roughly 400,000 ounces. The culprit is price: sustained weakness has forced producers to curtail output from deep, high-cost shafts—operations that had long been on the edge of economic viability. We’ll return to that issue in a moment.
Second, recycled supply has also come under pressure, down some 300,000 ounces over the last year. The decline has been concentrated in recycled autocatalysts, and the reasons are as much economic as behavioral. Used car prices have surged in recent years, and with them, the average age of the vehicle fleet. Drivers, particularly in the United States, are simply holding onto their cars longer. As of 2024, the average age of vehicles on American roads has reached a new record: 12.6 years—an increase of six months since 2020.
The consensus view is that scrap supply will rebound in 2025 and into 2026, as older vehicles cycle out of use. We’re not so sure. New car prices remain elevated, and the recent reintroduction of tariffs under President Trump’s economic policy playbook is adding fresh upward pressure. If price alone weren’t enough to delay trade-ins, there is now a regulatory wrinkle worth noting.
Tucked into the 2021 Infrastructure Investment and Jobs Act is a little-discussed provision mandating that, starting in 2026, all new vehicles sold in the U.S. be equipped with alcohol detection systems. Should the law remain in force—and should efforts to repeal it prove unsuccessful—we believe many Americans will respond as they often do: by opting out. The used car market, already tight, could become a haven for drivers keen to avoid the surveillance built into the next model year.
If that happens, the rebound in recycled PGM supply may prove far weaker than expected. And if that’s the case, prices will have to rise—meaningfully—to draw secondary material back into the market.
And finally, it bears repeating: total PGM demand from the auto sector has proven far more resilient than commonly assumed. The widely publicized expectations for aggressive EV penetration—once treated as near-certainties—have thus far failed to materialize.
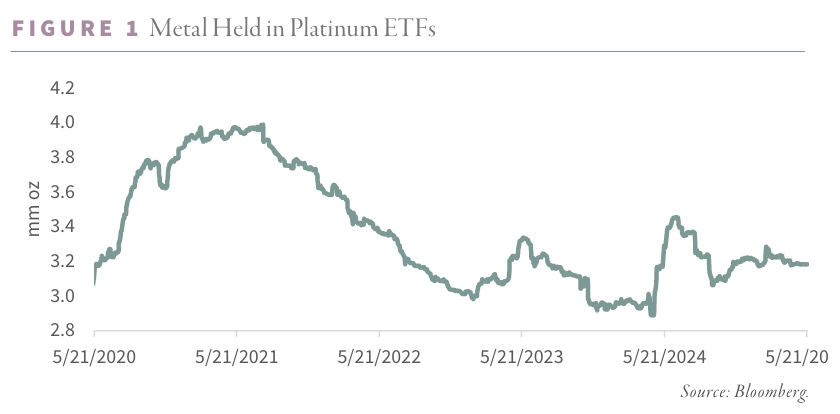
The bright spots in industrial demand, however, have been offset by a sharp collapse in investment appetite—particularly for platinum. The culprits are familiar: rising real interest rates and falling spot prices, a combination that has drained enthusiasm from western investors. It’s a pattern not unlike what has taken hold in gold and silver markets over the past several years.
Since 2020, investment in physical platinum has declined by 75%, driven in large part by redemptions from physical platinum ETFs—again, mirroring the dynamics in precious metals more broadly. At their peak in 2019 and 2020, combined demand from bars and ETFs reached 1.3 and 1.6 million ounces, respectively. By 2023 and 2024, that figure had shrunk to just 400,000 ounces.
That said, the tide may be turning. Falling real interest rates appear to be rekindling interest in physical holdings—platinum included. We monitor sixteen primary physical platinum ETFs. As illustrated in the chart below, the funds have halted their prior liquidations and have begun modestly accumulating metal once again—a tentative but encouraging sign that western investment demand may be returning.
Most analysts continue to forecast a return to surplus in platinum markets by 2026. But for that to happen, two things must occur simultaneously: recycled supply must rebound substantially, and investment demand must remain depressed. On both fronts, we are skeptical.
Large deficits over the past two years have meaningfully eroded above-ground inventories. After peaking near 5 million ounces in 2022, above-ground platinum stocks have declined by approximately 1.5 million ounces. If our projections for 2025 are correct, inventories will fall to 3 million ounces—down nearly 40% in just two years.
We believe the platinum market remains in structural deficit, and may do so for several years to come. Demand, particularly from the auto sector, continues to outperform expectations. Mine supply continues to disappoint—especially given that nearly 40% of global PGM production is now uneconomic at current prices. Recycled supply, expected to rebound, has shown little inclination to do so. And finally, western investment demand—currently at a cyclical low—appears poised for a meaningful recovery.
Palladium, for its part, is exhibiting many of the same dynamics now unfolding in platinum. That market, too, has operated in deficit for three years running, with 2025 expected to extend the streak. The combined shortfall over 2023 and 2024 approached 1.5 million ounces—nearly 15% of global demand.
The primary driver has been a steep decline in recycled palladium supply. In 2021, the World Platinum Investment Council estimated that recycled palladium totaled roughly 3.4 million ounces. That figure has since fallen by approximately 900,000 ounces, a decline largely attributable to the same structural factors affecting platinum: elevated used car prices and a steadily aging vehicle fleet. Adding to the shortfall is a 300,000-ounce reduction in primary supply, concentrated in South Africa.
Most analysts expect recycled palladium supply to rebound to 2021 levels—an assumption that underpins the broader consensus view that palladium markets will swing back into surplus by 2026. But as we’ve just outlined, the same forces weighing on recycled platinum are very much at play in palladium as well.
If we are correct—and if elevated used car prices and the looming requirement that all new U.S. vehicles sold from 2026 onward include mandatory ignition interlock devices lead consumers to delay new purchases—then expectations for a swift recovery in recycled palladium supply may once again prove overly optimistic. In that case, the current deficits in the palladium market could persist far longer than most forecasters are prepared to admit.
Low Prices, Tight Margins, and Supply Under Siege
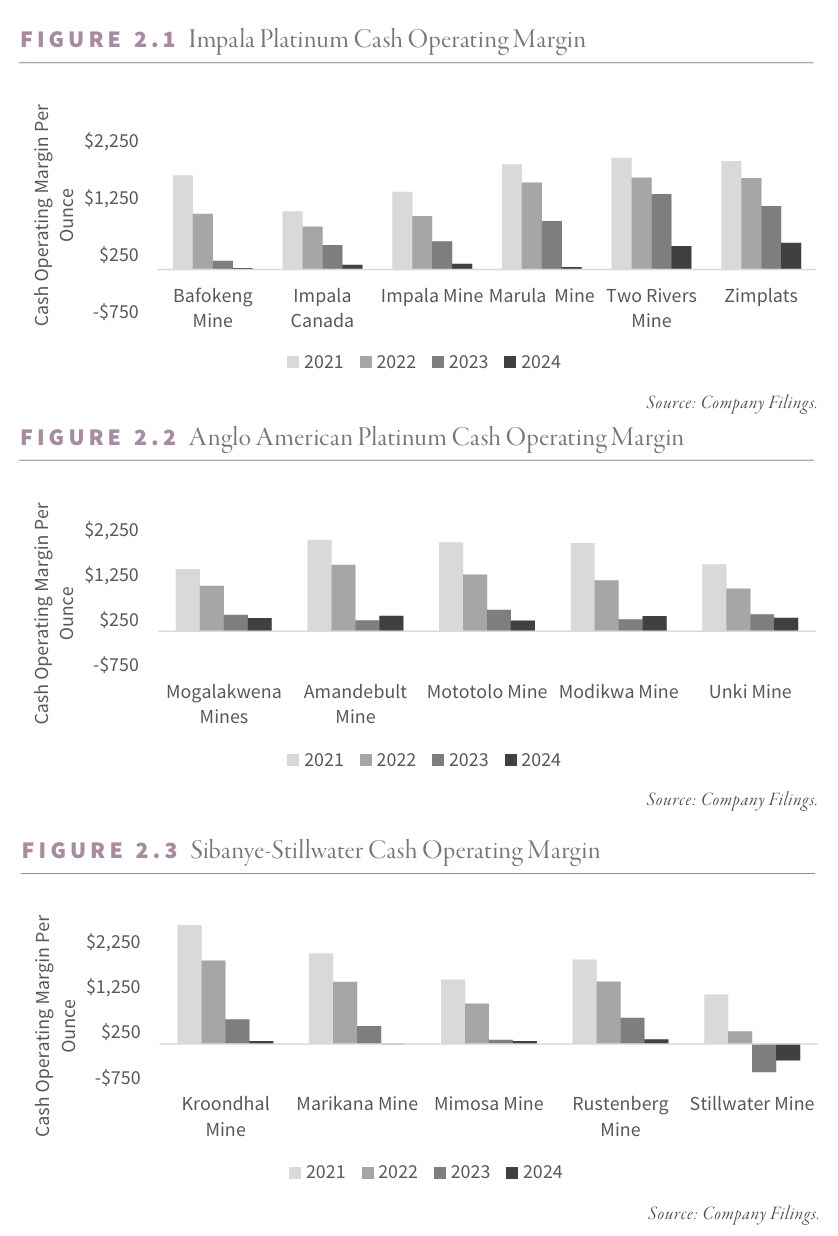
Over the past three years, the average basket price received by our universe of platinum group metals producers has declined by nearly 50%. In mid-2021, that basket approached $3,000 per ounce. Today, it has slipped to as little as $1,200. At these levels, nearly 40% of global PGM mine supply is operating at or below the cash cost threshold, according to recent data from the World Platinum Investment Council.
In our experience, when broad swaths of an extractive industry begin operating with negative cash margins, speculators find it increasingly difficult to push prices lower. Markets, as they say, find their bottom when selling meets resistance—and profitability disappears.
To underscore just how far margins have compressed, we’ve compiled data across the major PGM assets operated by the industry’s three dominant producers: Anglo American Platinum (Amplats), Impala Platinum, and Sibanye-Stillwater.
The individual mine data confirms what the aggregate numbers suggest: profitability across the industry has evaporated. The impact on supply has already begun to materialize. Since the early 2020s, platinum production in South Africa has fallen from 4.5 million ounces to 4.0 million—a decline of 500,000 ounces. Palladium output, meanwhile, has slipped from 2.7 million to 2.3 million ounces.
More recently, Impala Platinum disclosed that it is now weighing the closure of its Lac des Iles mine in Canada. The mine, which produces approximately 280,000 ounces of PGMs annually—90% of which is palladium—is operating deep in the red. Should it be shuttered, global palladium supply would fall by roughly 4%.
New supply, for its part, is limited. Only one notable mine—Platreef, on the eastern limb of South Africa’s Bushveld Complex—is scheduled to commence production in the near term. Phase 1 is expected to begin in the fourth quarter of 2025, with output of approximately 100,000 ounces split evenly between platinum and palladium. Phase 2, starting in 2027, would bring production to 450,000 ounces annually by 2029. Phase 3, targeted for 2033, would lift total output to 1 million ounces per year.
Even under conservative assumptions for demand growth between now and 2035, we believe the market can readily absorb this incremental supply—without exerting meaningful downward pressure on prices. Indeed, one might argue the opposite: even with Platreef’s future production fully priced in, platinum and palladium markets may struggle to exit their current deficit conditions.
The South African mining complex—long the backbone of global PGM production—is facing mounting structural constraints. Decades of underinvestment, coupled with geological depletion, mean that even sharply higher prices may fail to unlock new volume. In this context, the path to materially expanding supply looks narrow, costly, and slow.
Robust demand. Contracting supply. Persistent deficits. And an investment consensus built on a narrative we do not believe will hold. It is, in our view, the textbook setup for a bull market to begin.
As we wrote at the outset of this essay: we believe the time to buy PGMs—and the companies that produce them—is now.
Curious to learn more? Read more in our Q1 2025 research newsletter, available for download below.

Registration with the SEC should not be construed as an endorsement or an indicator of investment skill, acumen or experience. Investments in securities are not insured, protected or guaranteed and may result in loss of income and/or principal. Historical performance is not indicative of any specific investment or future results. Investment process, strategies, philosophies, portfolio composition and allocations, security selection criteria and other parameters are current as of the date indicated and are subject to change without prior notice. This communication is distributed for informational purposes, and it is not to be construed as an offer, solicitation, recommendation, or endorsement of any particular security, products, or services. Nothing in this communication is intended to be or should be construed as individualized investment advice. All content is of a general nature and solely for educational, informational and illustrative purposes. This communication may include opinions and forward-looking statements. All statements other than statements of historical fact are opinions and/or forward-looking statements (including words such as “believe,” “estimate,” “anticipate,” “may,” “will,” “should,” and “expect”). Although we believe that the beliefs and expectations reflected in such forward-looking statements are reasonable, we can give no assurance that such beliefs and expectations will prove to be correct. Various factors could cause actual results or performance to differ materially from those discussed in such forward-looking statements. All expressions of opinion are subject to change. You are cautioned not to place undue reliance on these forward-looking statements. Any dated information is published as of its date only. Dated and forward-looking statements speak only as of the date on which they are made. We undertake no obligation to update publicly or revise any dated or forward-looking statements. Any references to outside data, opinions or content are listed for informational purposes only and have not been independently verified for accuracy by the Adviser. Third-party views, opinions or forecasts do not necessarily reflect those of the Adviser or its employees. Unless stated otherwise, any mention of specific securities or investments is for illustrative purposes only. Adviser’s clients may or may not hold the securities discussed in their portfolios. Adviser makes no representations that any of the securities discussed have been or will be profitable. Indices are not available for direct investment. Their performance does not reflect the expenses associated with the management of an actual portfolio.