
The article below is an excerpt from our Q1 2023 commentary.
The most crucial development in global oil markets is depletion in the Permian basin. We first warned about this in 2018, predicting the Permian would peak in 2025. In retrospect, our analysis was too conservative. We now believe the basin could peak within the next twelve months. The implications will be as profound as when United States oil production peaked in 1970, starting a chain of events ultimately sending prices up five-fold over ten years. If we are correct, this could not come at a worse time for oil markets: inventories are tight, production in the rest of the world is declining, and investors are incredibly complacent.
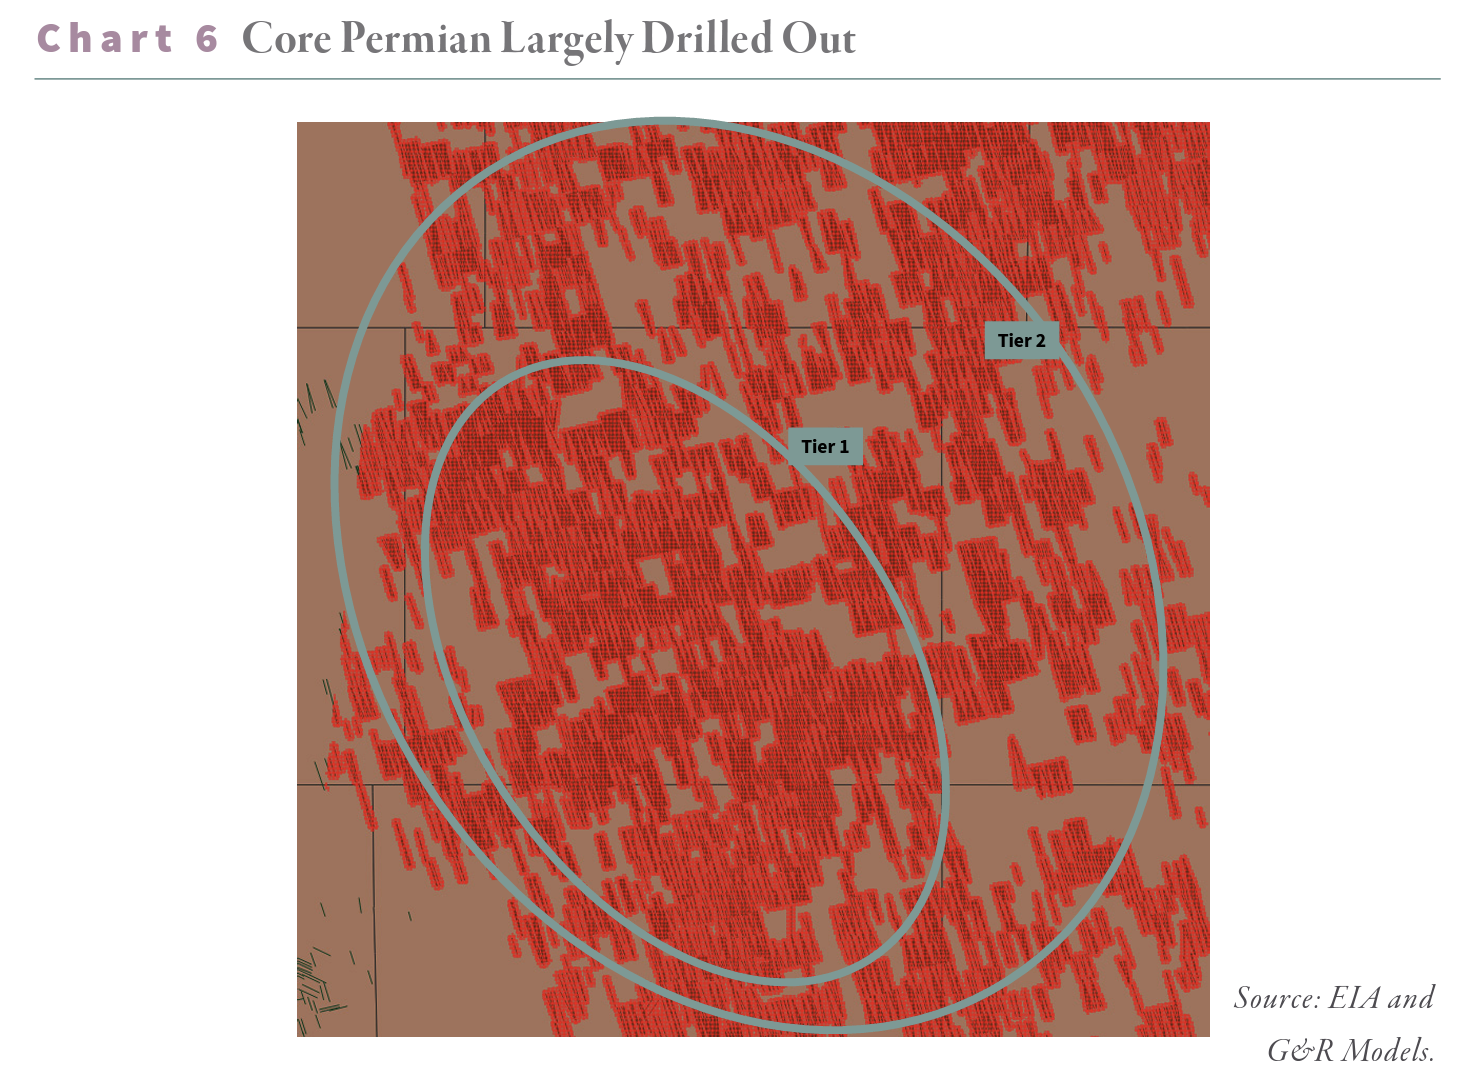
Whenever we make long-term thematic predictions, we construct a road map of things we should expect to see. Since price is rarely a good proxy for fundamentals, we need hard data that confirms we are going down the right path, even during the inevitable periods when the oil price is moving against us. Based upon our original work back in 2018, we concluded the Permian would roll over once operators drilled most of their best Tier 1 locations. Before peaking, per-well productivity would fall as operators drilled lower-quality inventory. This is what has happened. For the first time, productivity per lateral foot registered a 6% year-onyear decline in the Permian. According to our models, this proves the industry has drilled its best wells; basin-wide production decline is likely not far behind. With the Eagle Ford and Bakken unable to grow over the last eighteen months, once the Permian rolls over, the shale revolution will shift from growth to decline, and Hubbert’s Peak will reemerge with a vengeance.
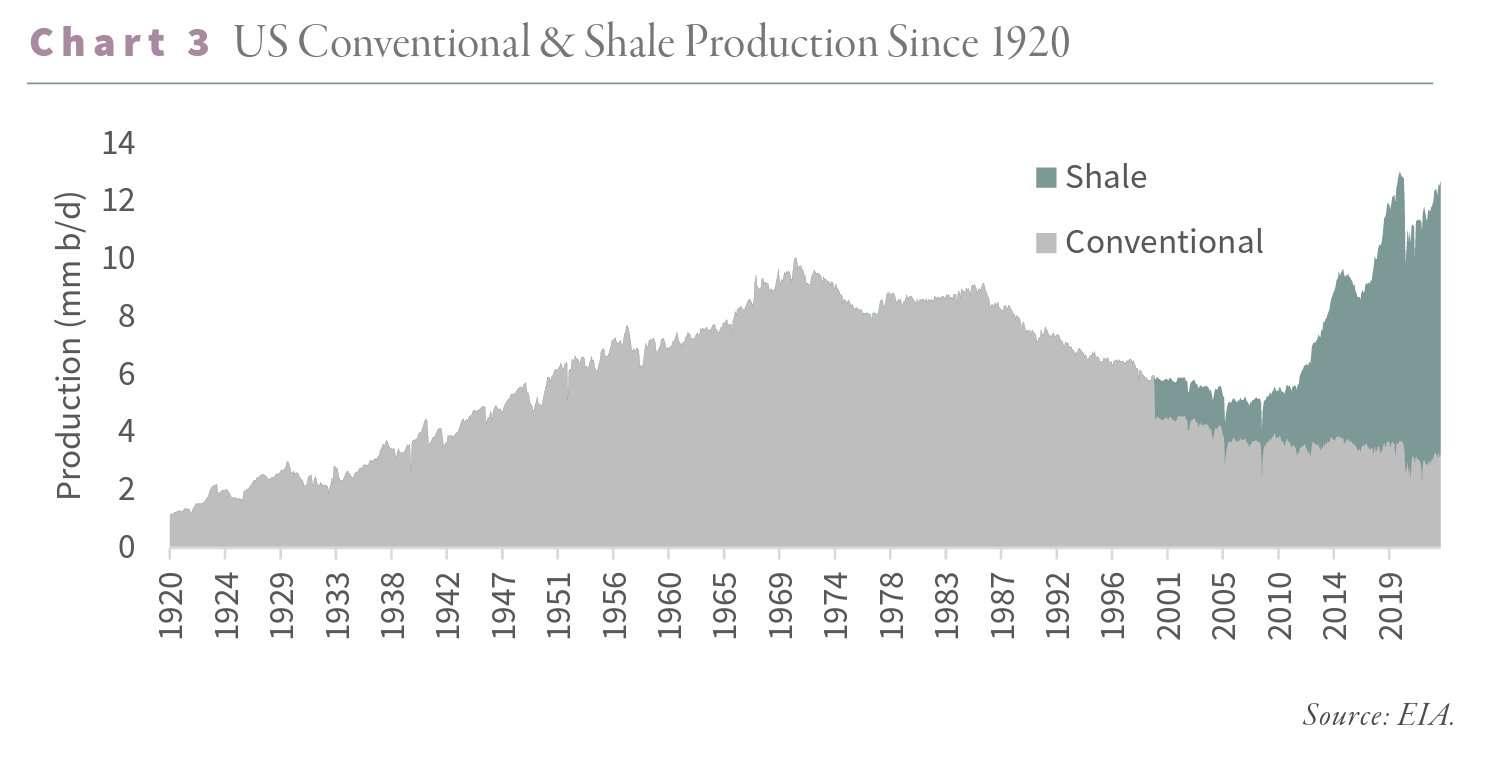
The past decade has indeed been remarkable for global oil markets. Operators first succeeded in developing natural gas shales before adapting the techniques to the oil shales starting with the Bakken in North Dakota. The Eagle Ford was developed next, and then finally, the largest of all, the Permian, with its stacked pay potential, started its development in 2012. The results were without precedent. After having declined by 50% over forty years, the US abruptly reversed course to become the largest oil producer in the world. Shale oil production went from zero to 10 m b/d, more significant than Saudi Arabia.
The shales could not have come at a better time. In 2003, China joined the World Trade Organization, and its crude demand growth markedly accelerated. In 2005, non-OPEC production growth began to falter, forcing crude markets into a structural deficit. As inventories fell, prices rose, prompting Malthusian warnings almost daily on CNBC and Bloomberg that we were “running out of oil”.
The shale revolution changed everything. By 2014, non-OPEC production growth reached 2.2 mm b/d, the most robust growth since at least 1966 — driven entirely by the shales.
As the shales ramped up between 2010 and 2018, they seemed limitless. However, even in the early stages of field development, there were warning signs that shale basins adhered to the same depletion principles as conventional fields. Enormous is not the same as infinite, we argued and warned that depletion would eventually take hold.
The shales seemed particularly invincible between 2014 and 2017. In the autumn of 2014, Saudi Arabia stunned the oil markets when it abandoned its role as a swing producer. Crude balances shifted into surplus in the middle of 2014, and instead of cutting production to balance the market, Saudi Arabia announced it would grow output by nearly 1 mm b/d. Immediately, crude prices fell by 15% from $75 to $60 per barrel and would drop by 65% over the next eighteen months to bottom at $26 by spring 2016. With much lower prices and capital-intensive drilling, shale developers reduced their drilling activity by 80%. In the summer of 2014, the industry turned 1,600 rigs; less than two years later, the rig count stood at only 325. Saudi Arabia relented in late 2015, with prices stabilizing a few months later, in February 2016. The shale rig count bottomed in June.
Somehow shale production stabilized and started to grow shortly after that. Even though the rig count was still down 60%, US production was again registering yearly growth as soon as April 2017. By 2018, the shales were growing by 1.8 mm year-on-year — a record, despite a rig count that remained 50% lower than in 2014.
The shales seemed to defy the laws of physics: they could grow materially despite much lower drilling activity. The industry appeared to have entered a world where it no longer needed increased drilling to boost production.
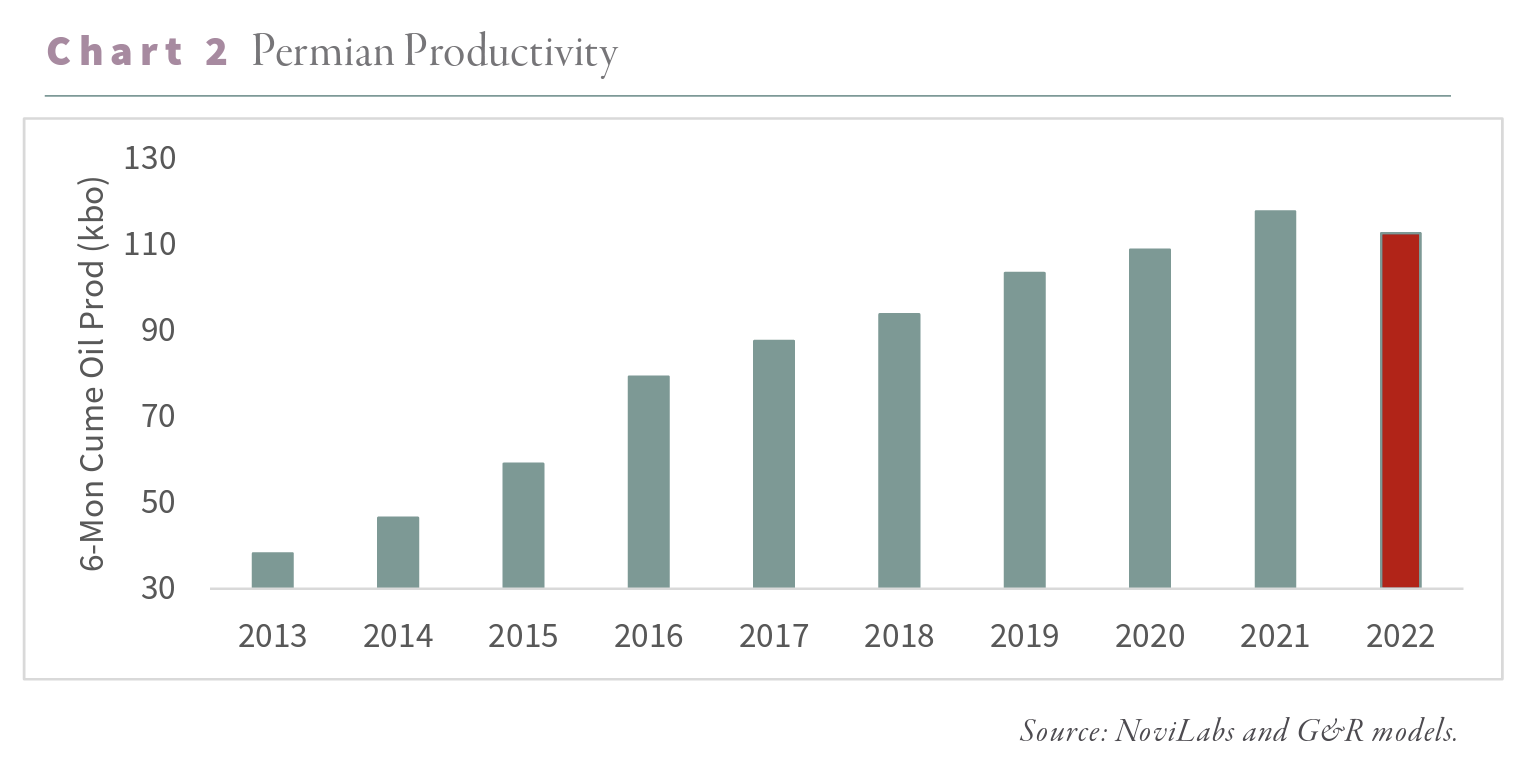
How was this possible? The answer was drilling productivity. Between 2013 and 2017, the average shale well went from averaging 70,000 barrels of oil over the first twelve months to 140,000. On the Midland side of the Permian basin, the primary source of supply growth, twelve-month productivity nearly tripled from 50,000 to 140,000 barrels.
Since each well brought on so much more oil than before, the industry could now achieve with 400 rigs, what it took 1,600 rigs to produce a few years earlier.
Conventional wisdom believed the industry had improved its drilling and completion of shale wells. The ability to stay in the zone, the choice, and the volume of proppant and fluid were all said to have resulted in sharply higher drilling productivity. Wall Street and the energy industry both promoted a consistent narrative. We felt there were several unanswered questions and undertook a study to consider what was driving surging well productivity. If the industry had radically improved drilling techniques, it would ultimately be bearish for the sector. A previous low-quality Tier 2 location could now be transformed, through enhanced drilling and completion techniques, into a top-quality Tier 1 well. As a result, the inventory of best wells would explode, and the shale basins would continue to thrive for years to come.
Modeling well performance is hugely complex. Shale basins are highly nonlinear with high degrees of variable inter-dependence. As a result, traditional statistical techniques, such as the linear regressions used by most analysts, fall short. We turned to advanced methods, including machine learning and neural networks, and achieved surprising results. Instead of improved drilling techniques, we concluded that two-thirds of the improved productivity between 2013-2018 came from favoring the best drilling locations. In 2013, 22% of Midland wells were Tier 1. By 2018, Tier 1 represented 50% of all wells. Since a Tier 1 well is nearly twice as productive as a Tier 2 well, the migration from lower to higher quality areas drove a massive amount of the improved well productivity.
The industry was not turning Tier 2 into Tier 1 but, instead, was aggressively depleting its inventory of top-quality wells.
We determined that the pace of high-grading could not continue, particularly in the Eagle Ford and Bakken. Our models suggested that by 2018, 60% of the best acreage in those two earliest developed basins had already been developed. The Permian was developed last, so it still had over 60% of its Tier 1 areas left to drill, but we were concerned that given its pace, it too could soon become depleted. In our 2Q2019 letter, we predicted the Eagle Ford and Bakken would quickly peak while the Permian plateau in the late 2020s at 6.5 m b/d. While the Permian would still manage to grow another 2.5 m b/d from 2018 levels, its annual growth rate would slow materially from 500,000 m b/d per year between 2013-2018 to only 200,000 b/d between 2019 and 2029.
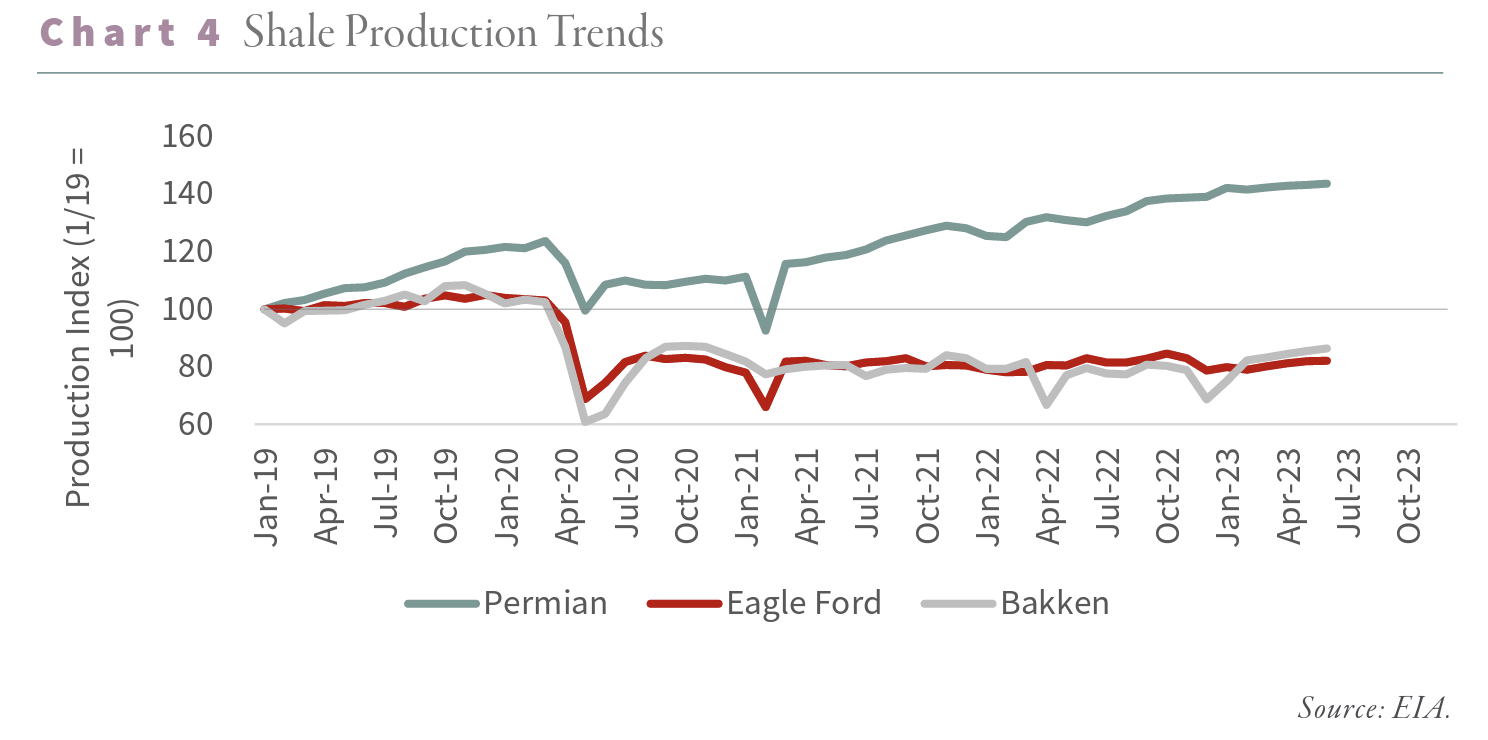
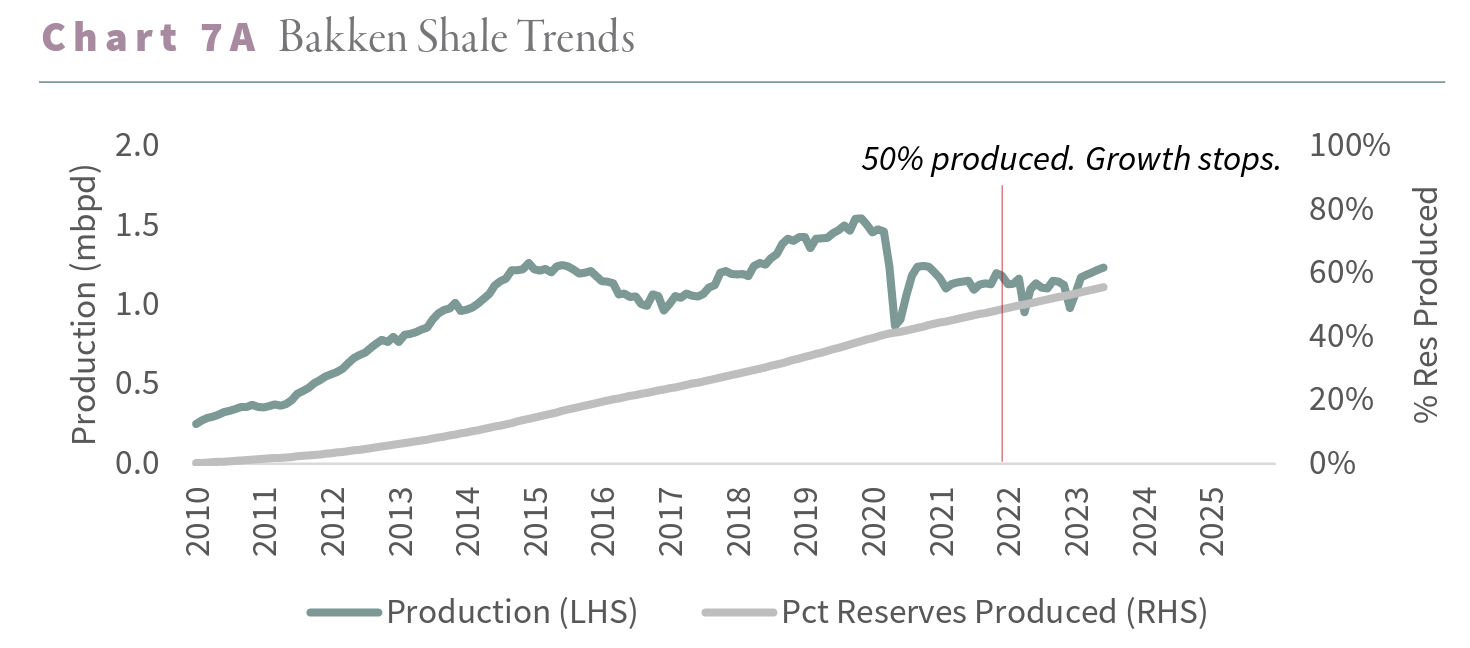
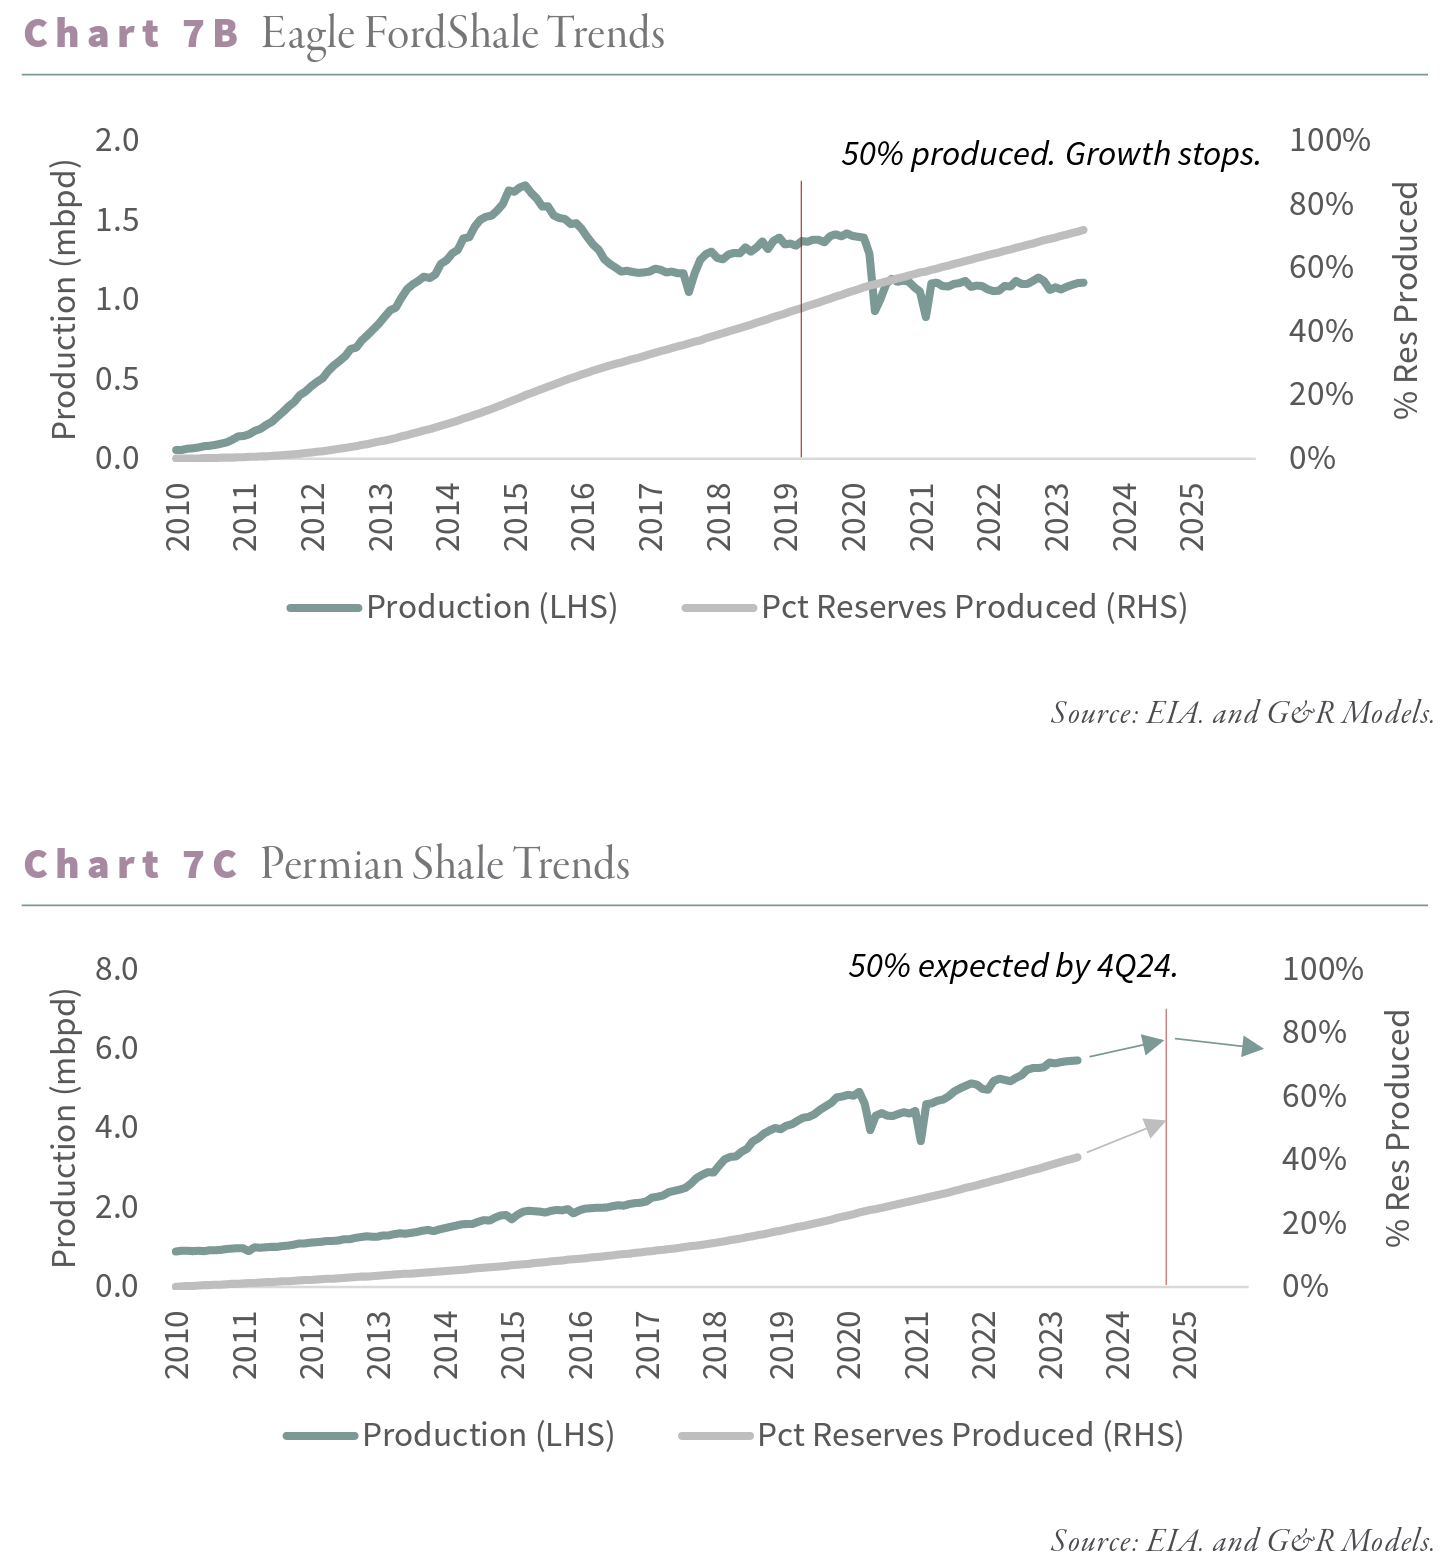
The impacts of COVID-19 complicated our models; however, our predictions have been directionally sound. All three basins declined sharply in 2020, as fears of breaching inventory capacity forced prices negative and led to widespread shut-ins of existing wells. Between March and May 2020, total production from the Eagle Ford, Bakken, and Permian fell by over 2 m b/d. Since then, all three basins have brought back their shut-in production, but in the case of the Eagle Ford and Bakken, production remains 500,000 b/d below the pre-COVID March 2020 highs. Neither play has grown since November 2020. Just as our models indicated, the Permian was the only basin still able to grow. Between March 2020 and May 2023, the Permian rose by 800,000 b/d to an all-time high of 5.7 m b/d.
Unfortunately for global oil markets, our models tell us the Permian is also very close to plateauing. If we are correct, then the only source of non-OPEC growth over the past 15 years is about to shift from growth to decline.
We have spent the last several months completing and updating our machine-learning models. We owe a debt of gratitude to both the data and analytical insights provided by NoviLabs (formerly ShaleProfile), our data providers. Since we first built our neural network in 2018, NoviLabs has dramatically enhanced its database. Whereas our original models relied upon geographical data (i.e., where a company drilled a well) and completion data (i.e., how a well was drilled and completed), our latest model incorporates actual subsurface geological data. Our original models inferred the best Tier 1 acreage based on nearby well results. Our new model adds geological parameters such as thickness, thermal maturity, organic content, oil in place, porosity, and permeability to make accurate well-quality predictions. We have also been able to more accurately attribute well-quality changes to each parameter using state-of-the-art SHAP values. While a complete discussion of SHAP values is beyond the scope of this letter, in summary, they explain how a change in inputs impacts well quality in a very interpretable manner.
Between 2013 and 2018, Permian productivity increased by 153%, with three-quarters of the increase explained by improved geology—moving the drilling rig from a tier 2 to a tier 1 location--and increased lateral lengths. When we wrote in 2019, we predicted that Permian per-well productivity was likely nearing its maximum, and, in retrospect, that was correct. Between 2018 and 2021, per-well productivity growth slowed dramatically, advancing by only 20%, all of which was due to longer lateral lengths. On a per-lateral foot basis, there was no growth at all.
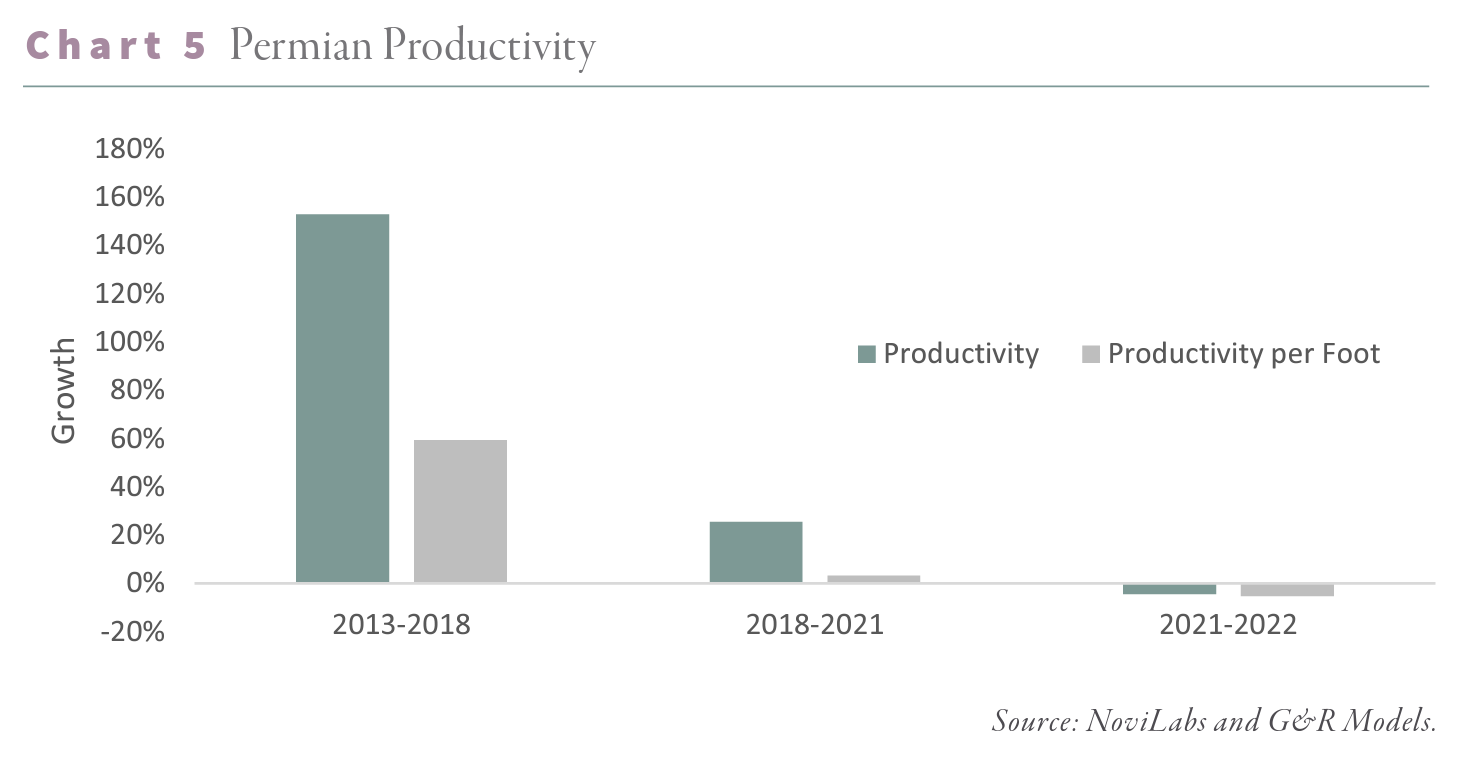
The Wall Street Journal recently wrote a pivotal article (using data from NoviLabs) stating that Permian per-well productivity fell in 2022 for the first time in the field’s shale development history. Our analysis confirms these results: Permian per-well productivity fell 8% last year. The drivers of the lost productivity will only get worse. Our models tell us geological depletion will continue. Permian produces are now being forced to drill worse quality rock for the first time.
Furthermore, the Permian is also suffering from parent-child setbacks. In the early days of shale development, producers would often drill a single horizontal well to test different parts of the basin and satisfy lease obligations that often require drilling a well within an allotted period. Later, the developer returns to the best areas and drills several more wells from a single pad to develop the resource economically. Producers now realize that the so-called “child” wells produce between 5 and 20% less oil than expected. In 2012 we estimate that only 30% of wells drilled in the three significant shale basins were “children.” By 2022, that figure had reached 85%. In Tier 1 areas, effectively, all current wells are children, with lower-than-expected productivity.
After several years of aggressive high-grading, we estimate the Permian has now developed nearly 60% of its Tier 1 acreage. The Eagle Ford and Bakken hit this same level of Tier 1 development in 2018, right before production stopped growing. Today, the Bakken is the most developed of all three major basins, with 66% of its Tier 1 wells developed and nearly 90% of its best areas thoroughly drilled. When we first made these predictions in 2019, we expected the Permian had until 2025 before it reached these levels, but in retrospect, we were likely too optimistic.
King Hubbert hypothesized that a hydrocarbon basin would peak once half the recoverable reserves were produced. Even though his theories referred to conventional basins, we have long believed that shale basins should behave similarly. The difficult task is estimating the recoverable reserves from each basin. Luckily, our models can help here as well. We count 7 and 9 billion barrels of recoverable oil in the Eagle Ford and Bakken, respectively, of which 65% and 55% have been produced. Consistent with Hubbert’s theories, both basins have been unable to grow after crossing the 50% mark. The Eagle Ford produced half its recoverable reserves in August 2019; production has fallen 18% since. The Bakken produced half of its reserves in 2022, and production has since been flat. Our models tell us the Permian will ultimately recover 34 bn barrels of oil, of which 14 bn or 41% have already been produced. At current production levels, the Permian will have produced half its recoverable reserves sometime in late 2024; at this point, it will most likely stop growing, just like the other two basins.
Predicting a peak in basin-wide production is difficult; fields can often eke out slightly more growth than initially anticipated. Whether the Permian peaks next month or nine months from now is subject to more variability than any analyst can confidently predict. However, we know that geological depletion is clearly taking place and will likely get worse. Year-on-year growth in the Permian appears to have peaked at 656,000 b/d in February and is already down to 480,000 b/d year-on-year in May. While the data may be lumpy, we expect this slowdown to continue and believe we may not see any year-on-year growth by the end of next year.
Finding attractive investment opportunities in shale E&P companies will become very difficult. Here too, we believe our machine-learning models can help. Based on current drilling activity, the average publicly traded Permian company will run out of Tier 1 drilling locations within 3.7 years. Our core positions, on the other hand, likely have between five and ten years of high-quality drilling ahead of them. As productivity becomes harder to achieve, these companies should present good opportunities. Already, we have seen rumors of Exxon - Mobil seeking to acquire Pioneer Natural Resources. We own Pioneer and do not know whether these rumors are true. However, we firmly believe that as the market realizes how little Tier 1 acreage remains, those with the best inventory will be treated as valuable assets.
If we are correct, the age of shale growth is now behind us, and the reality of Hubbert’s Peak is at hand. The immense growth of the shales over the past decade has blinded many analysts to the declining trends in global conventional production. That luxury is about to end.
Intrigued? We invite you to download or revisit our entire Q1 2023 research letter, available below.
Registration with the SEC should not be construed as an endorsement or an indicator of investment skill, acumen or experience. Investments in securities are not insured, protected or guaranteed and may result in loss of income and/or principal. Historical performance is not indicative of any specific investment or future results. Investment process, strategies, philosophies, portfolio composition and allocations, security selection criteria and other parameters are current as of the date indicated and are subject to change without prior notice. This communication is distributed for informational purposes, and it is not to be construed as an offer, solicitation, recommendation, or endorsement of any particular security, products, or services. Nothing in this communication is intended to be or should be construed as individualized investment advice. All content is of a general nature and solely for educational, informational and illustrative purposes. This communication may include opinions and forward-looking statements. All statements other than statements of historical fact are opinions and/or forward-looking statements (including words such as “believe,” “estimate,” “anticipate,” “may,” “will,” “should,” and “expect”). Although we believe that the beliefs and expectations reflected in such forward-looking statements are reasonable, we can give no assurance that such beliefs and expectations will prove to be correct. Various factors could cause actual results or performance to differ materially from those discussed in such forward-looking statements. All expressions of opinion are subject to change. You are cautioned not to place undue reliance on these forward-looking statements. Any dated information is published as of its date only. Dated and forward-looking statements speak only as of the date on which they are made. We undertake no obligation to update publicly or revise any dated or forward-looking statements. Any references to outside data, opinions or content are listed for informational purposes only and have not been independently verified for accuracy by the Adviser. Third-party views, opinions or forecasts do not necessarily reflect those of the Adviser or its employees. Unless stated otherwise, any mention of specific securities or investments is for illustrative purposes only. Adviser’s clients may or may not hold the securities discussed in their portfolios. Adviser makes no representations that any of the securities discussed have been or will be profitable. Indices are not available for direct investment. Their performance does not reflect the expenses associated with the management of an actual portfolio.