
The article below is an excerpt from our Q1 2023 commentary.
In 2016, we published the following chart comparing commodities to the Dow Jones Industrial Average. Mr. Gundlach of DoubleLine had issued a similar chart; however, his version only went back to the inception of the Goldman Sachs Commodity Index in 1970. We were interested in studying previous cycles and decided to construct our equivalent index back to 1900.
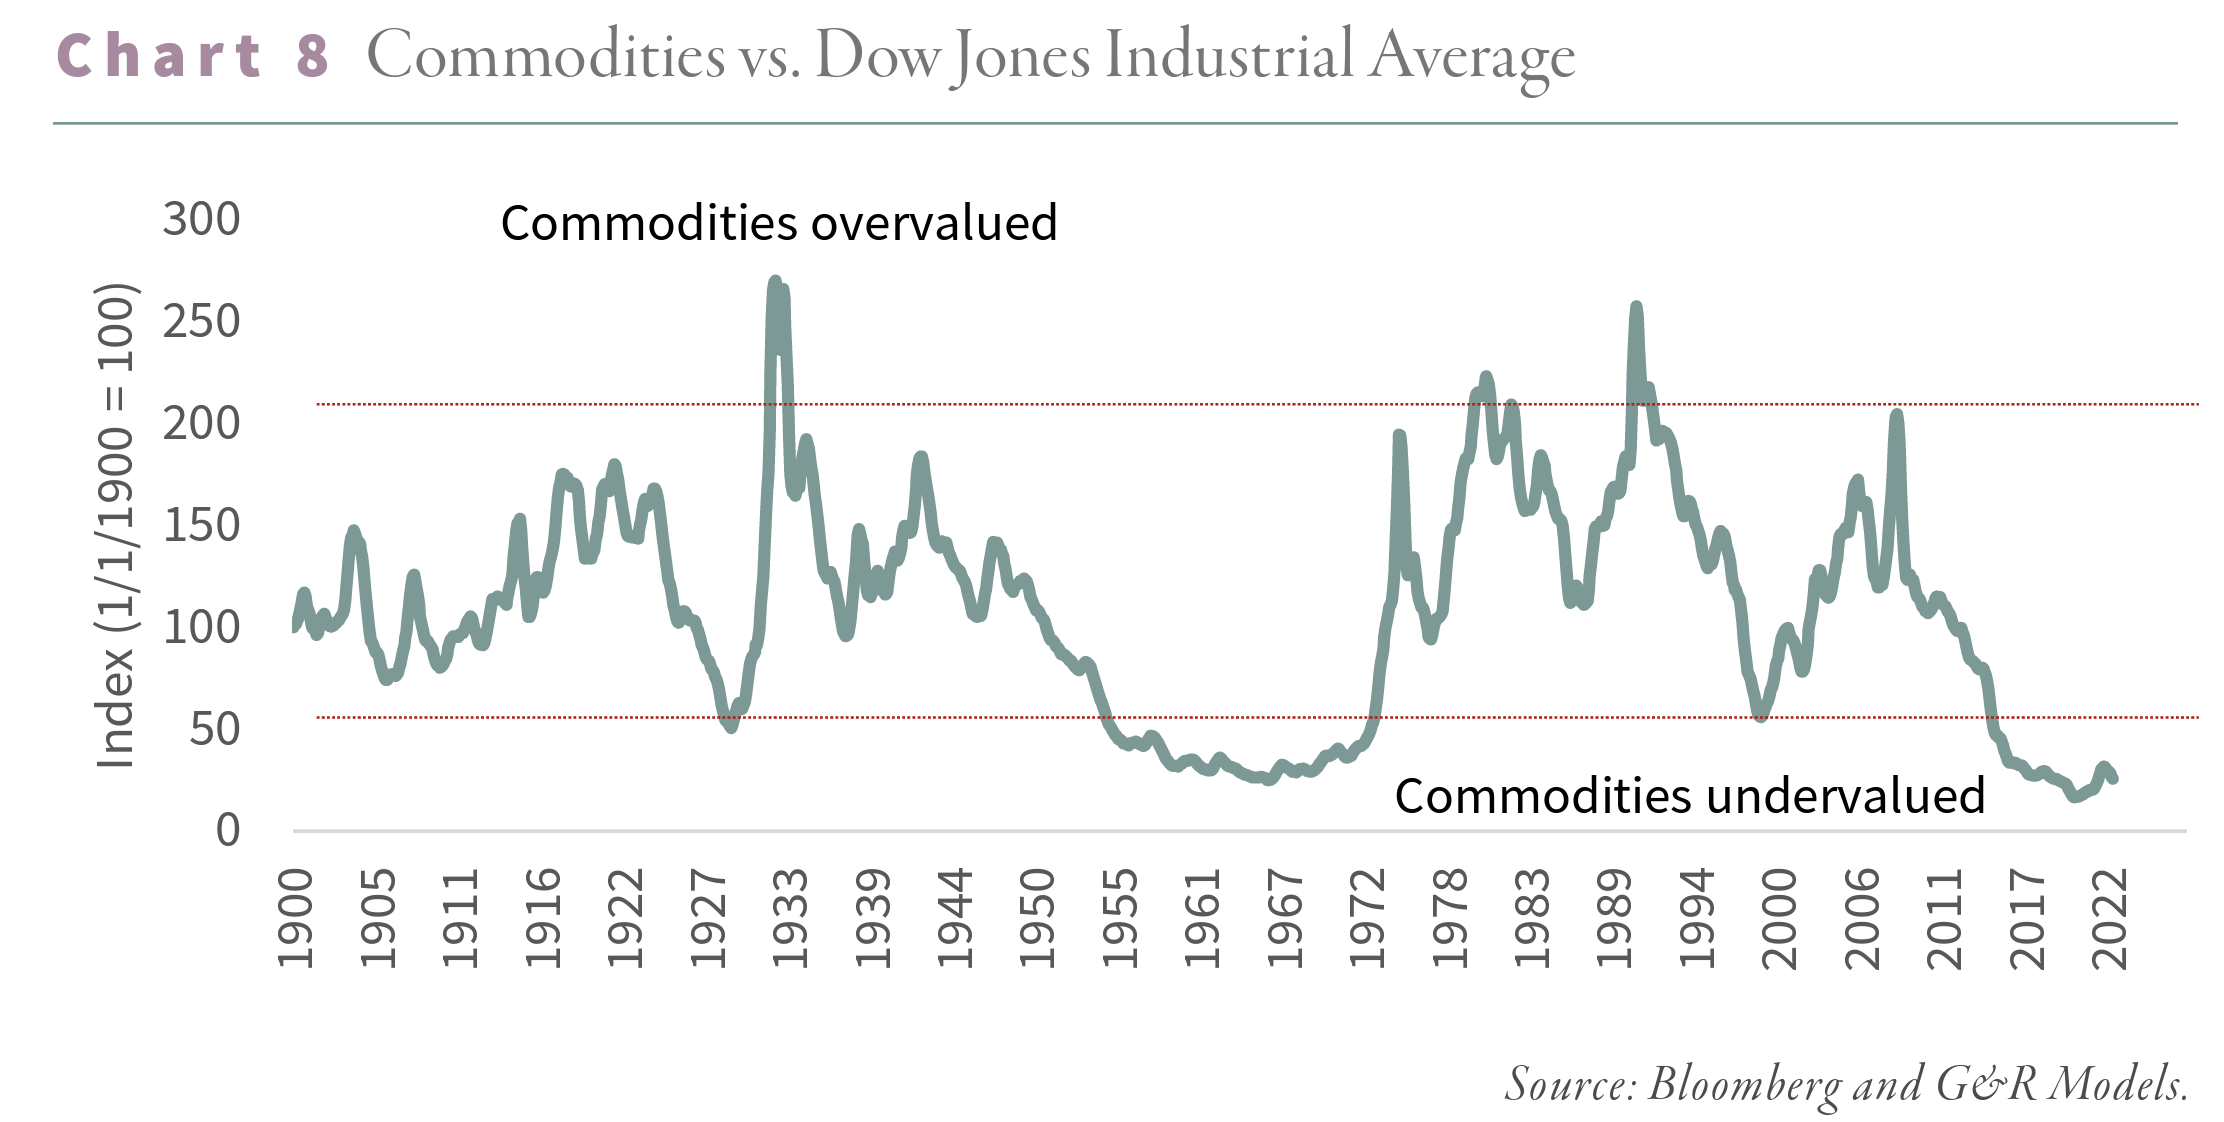
Incredibly, by 2016 commodity prices had sold off to such an extent that they were the most radically undervalued in 120 years. The only times that came close were in 1929, 1969, and 1999. Following every prior period of radical undervaluation, commodity and natural-resource related investments dramatically outperformed, both in absolute and relative terms. This cycle, we argued, should be no different. While the 1970s and 2000s bull markets are well studied, we were stunned that commodities and natural resource equities did well during the Great Depression. A simple equally weighted portfolio of energy, base metal, precious metal, and agricultural stocks bought at the market peak in 1929 more than doubled by 1938 compared with the broad market that remained 50% lower. Indeed, owning commodity stocks throughout the Great Depression was the only way to preserve one’s wealth. Given the concerns of an impending recession, those worried about resource investing should take note. During the 1970s, a similar portfolio split evenly between the four sectors advanced by 500%. While the S&P 500 managed to advance by 170%, it barely kept up with inflation. Investing in natural resource equities was one of the few ways to grow purchasing power. From 1999 to 2010, there were two massive market pullbacks (the dot com bubble and the Global Financial Crisis) and the most significant financial crisis since the Great Depression. While the S&P 500 was flat between 1999 and 2010, with great turmoil, a similar portfolio of resource equities surged by 300%. Again, resource stocks were one of the few days to avoid the calamities of the early 2000s.
The more we studied the three periods of radical commodity undervaluation, the more we recognized certain similarities.
First, for commodities to become radically undervalued relative to stocks, they must decline in price. Before every extreme low in our analysis, commodity prices fell sharply. Following the end of World War I, there was a strong and sustained bear market in commodities through the 1920s, during which most prices fell by 60%. There was a drawn-out commodity selloff from 1945-1960 that saw prices fall by 20%. Commodity prices were weak once again throughout the 1980s and 1990s. Gold peaked in 1980 at $850 per ounce and spent the next two decades falling by 70%. Crude peaked at $45 per barrel] in 1979 and lost 75% over the next eighteen years before bottoming at $11 per barrel in 1999. The recent commodity bear market was the most severe in many regards. After peaking at $145 per barrel in the summer of 2008, crude prices spent the next 12 years falling more than 100% to reach the unfathomable price of -$45 per barrel.
Second, excess money creation and easy credit preceded every period of radical commodity undervaluation. In the 1920s, the US Federal Reserve engaged in its first bout of quantitative easing. Britain had suspended gold convertibility of the pound during World War I. Once hostilities ended, Britain was desperate to return to the gold standard at its pre-war exchange rate. Federal Reserve Chairman Benjamin Strong tried to help Britain achieve its goal by lowering short-term US interest rates despite a robust US economy, helping devalue the dollar and push the pound. Strong bought significant quantities of short-term treasury bills in 1924 and 1927.
Throughout the 1960s, the combination of Johnson’s Great Society programs and Vietnam War spending necessitated the help of an accommodating, albeit reluctant, Federal Reserve. Multiple banking, financial, and currency crises, requiring several rounds of accommodative monetary policy, bedeviled the 1990s. Most recently, the lowest interest rates and loosest monetary conditions in human history characterized the 2010s. The Federal Reserve’s balance sheets exploded from $900 bn in 2007 to $8 tr by 2020. By the summer of 2020, over $17 tr of global bonds sported negative nominal interest rates – a first in four thousand years of human history.
Third, each period of radical commodity undervaluation was associated with an investment mania elsewhere in the market. This observation follows logically from the last. Loose credit and excessive money printing lead to speculative malinvestment and asset bubbles. The 1920s saw a massive stock market boom culminating with the famous “Coup de Whiskey,” administered to the market when Strong injected ample liquidity into an already robust economy. Technology stocks did remarkably well. Shares of Radio Corporation of America were market leaders, with rampant speculation fueled by unprecedented use of financial leverage. A stock market crash and the most significant bear market in US history followed the blow-off top in the fall of 1929. The 1960s and early 1970s saw substantial bull markets accompanied by intense stock market speculation in new areas, such as conglomerates and growth stocks. The result was the “Nifty Fifty, in which fifty stocks, each with a P/E ratio 50x, could do no wrong. Driven by easy money and the internet introduction, the US market reached its greatest over-valuation by the late 1990s. The past decade has had several asset bubbles and investment manias. FAANG stocks, cryptocurrencies, and passive index funds all contribute to the “everything bubble” of the 2010s.
After studying these trends for several years, we concluded that the commodity capital cycle intimately connected them. Edward Chancellor’s "Capital Cycles" proved invaluable in helping us refine our views. An idealized commodity capital cycle progresses as follows: commodity prices are high, and producers enjoy a period of super-normal profits. Capital flows in chasing returns and results in elevated producer valuations. Companies raise vast amounts of money and deploy it on new projects. Supply increases and overshoots demand, pushing the market into surplus and depressing prices. Projects, underwritten at much higher commodity prices, become impaired and large amounts of capital are written off. Investors begin to turn away from commodity investments, and money pours out of the space, depressing valuations and leaving companies unable to tap capital markets. Investment stops, and companies abandon new projects, grinding supply growth to a halt. Depletion inevitably takes hold, tightening the market until eventually, surplus gives way to deficit, and a new cycle begins.
This framework perfectly explains the periods of radical commodity undervaluation we studied above. A commodity boom that saw production grow sharply preceded each period. Supply overwhelmed demand, pushing down prices. Investors left the industry for dead and moved into the investment mania of the day. Cheap credit allowed for malinvestment, pushing the mania further and making commodity investments even less appealing. Commodity producers became capital-starved, and depletion took hold.
The remaining question is what ended each period of radical commodity undervaluation and ushered in the new bull market. The answer is a fundamental shift in the global monetary system. By 1929 it was clear that Britain would be unable to keep the Pound tied to gold, effectively ending the classical gold standard in place since the early nineteenth century. The resulting financial turmoil included US history’s most significant stock market crash and a global banking crisis. Eventually, the unrest forced a massive 60% devaluation of the US dollar in 1934. The bottom in commodities relative to financial assets occurred concurrently with the ending of the classical gold standard.
During the 1960s, the United States ran ongoing budget deficits to fund the combination of Johnson’s Great Society program and the Vietnam War. As a result, starting in the mid-1960s, the Treasury suffered persistent outflows of gold as foreign governments exchanged their excess dollars for gold bars, per the 1944 Bretton Woods Exchange Agreement. By 1967, gold outflows had grown so large that the Treasury risked no longer being able to honor its commitment to back each dollar with 25 cents of gold. In 1968, Johnson signed into law a bill eliminating the dollar’s gold backing. While most believe Nixon took the dollar off gold, it was Johnson who stopped the dollar’s required gold backing. It took three years to eventually deplete the Treasury’s gold holdings to the point where Nixon no longer allowed convertibility in 1971. Although it received little attention then, this shift in monetary policy in 1968 corresponded with the beginning of the enormous commodity bull market that would last the next thirteen years. The resulting colossal dollar depreciation was again a significant stimulant to the massive commodity bull market that raged throughout the 1970s.
The monetary shift that precipitated the end of the 1999 commodity bear market is less noticeable but equally important. Throughout the 1990s, many emerging markets chose to peg their currency to the US dollar. The rationale was that the Treasury would provide emergency liquidity via US dollar swap lines in a financial panic. The collapse of Long Term Capital Management in 1998 led to an emerging market rout that escalated once it was clear the Federal Reserve would not bail out emerging markets. Several currencies collapsed overnight. Between 1997-1998 the Indonesian rupiah, Thai baht, Malaysian ringgit, and South Korean won tumbled between 50 and 85%. Following the crisis, many emerging market economies instead adopted a managed currency policy in which they would suppress the value of their currency to promote exports.
Undervalued currencies resulted in surging current account surpluses, the proceeds of which were recycled primarily into US Treasuries. In 1996, Asian economies ran net current account deficits totaling 2% of GDP. By 2005 these same countries ran current account surpluses totaling 5% of GDP. These surpluses resulted in trillions worth of US dollar accumulations which were recycled back into Treasuries. The new monetary system, born of the 1998 currency crisis, enabled OECD countries to borrow and overconsume for almost a decade, resulting in the 2008 housing and related global financial panic. Emerging market currency suppression again massively stimulated commodity consumption in the emerging world— with China being the best example.
As we enter what we believe to be a decade-long resource bull market, three of the four pre-conditions are unequivocally in place. Since 2010, commodity prices have pulled back more than 70%. The bear market severely impacted cash generation in many commodity industries. Companies have slashed capital spending dramatically. Money creation reached extremes in the 2010s. In the summer of 2008, the US Federal Reserve’s monetary base was $850 bn, or approximately 6% of GDP. By the end of 2021, it had exploded to almost $6.5 trillion representing an incredible 30% of GDP. The money creation over the last twelve years has no parallel in US history, exceeding those in the 1920s, 1960s, and 1990s. Easy credit has led to an “everything” bubble. Equity valuations are nearly as high as in 1999, while at the peak, over $17 tr of fixed-income securities sported negative nominal yields – a first in history. FAANG stocks and crypto-currencies are the mania of the day, much like RCA was in the 1920s, the Nifty Fifty were in the 1960s, and dot-com stocks were in the 1990s.
The only missing element has been a shift in the global monetary system. The final piece may be coming into place: the US dollar might be on the verge of losing its reserve currency status. A change in the dollar’s reserve currency status would be the most impactful market shock of the last forty years. According to our analysis, it would also most likely correspond with a period of robust commodity performance. The monetary regime changes in 1930, 1968, and 1998 were hugely stimulative for commodity prices, and we believe the monetary regime change that will take place this decade will be no different.
Following the Bretton Woods Agreement in 1944, the US has enjoyed a unique advantage: nearly 90% of global trade has been settled in US dollars. When Australia sells coal to China, they pay in dollars. The result has been a persistent demand for dollars outside the US to facilitate global trade settlement. US dollars are recycled into Treasuries, allowing the US to run persistent deficits. Critics have called the current system unsustainable for years and warned that a change is near.
Luke Gorman of Forest For The Trees has written about the end of the US dollar reserve status for nearly a decade. We were never convinced a change was imminent, given we saw no actual evidence countries were moving away from the dollar. While the arguments made sense, China continued buying Australian coal in dollars, and foreign Central Bank Treasury holdings remained elevated. The US reserve currency status may have been unsustainable, but at the time, it appeared intact.
We believe this is starting to change. The past twelve months have seen a spate of announcements of countries looking to settle trade in currencies other than the dollar. Although details remain scarce, Saudi Arabia has discussed settling its oil sales in renminbi. All sanctioned Russian oil sales have been paid for in renminbi to avoid the SWIFT banking system necessary for US dollar settlement. In April 2023, the Brazilian government announced intentions to set up the infrastructure to settle trade in renminbi. In the strongest rebuke of the current US dollar reserve currency system, Brazilian President Lula rhetorically asked before a group in China: “[…] why all countries have to base their trade on the dollar. Why can’t we do trade based on our currencies? […] Who decided that the dollar was the currency after the disappearance of the gold standard?” Even in Europe, the sentiment appears to be changing: TotalEnergies agreed to sell LNG into China and settled in renminbi.
Zoltan Poszar, Louis Gave, and Luke Gorman have written some of the best research on the changes now affecting the global monetary order. Some analysts believe fifteen years of excess money printing is to blame, while others cite the “weaponization” of the dollar or the ongoing political dysfunction in Washington.
To some extent, the causes are unimportant. What matters is that the move away from the dollar has started. If this trend continues, it would represent the end of the US dollar as the global reserve currency. The writing has been on the wall for a long time, but the change is only occurring now. That is what matters.
Every other period of commodity undervaluation culminated with a shift in global monetary regimes. This time will likely not be different. Proponents of the US dollar argue that no other currency can meet the requirements of a reserve currency. While much talk has centered on the renminbi, China maintains a mostly closed capital account -- a clear impediment to a reserve currency.
As commodity exporters amass renminbi, there is no apparent outlet for them to convert their capital. Of course, Chinese goods remain a strong export market; however, these are not enough to balance the trade with commodity producers. While Louis Gave correctly points out that China is building a robust Chinese Government Bond market, this only pushes the problem into the future when the bonds mature. Indeed, commerce covets the US dollar because it is a unit of exchange accepted as collateral worldwide. CGBs do not hold the same appeal.
Any move by China to displace the US dollar as a reserve currency must include some degree of gold convertibility. Foreign holders could then convert some portion of their trade surplus from renminbi into gold via the Shanghai gold exchange. China has accumulated vast amounts of gold in recent quarters, making such an outcome more plausible. If this were to happen in earnest, commodities would go from radically undervalued to radically overvalued -- likely led by gold. Every other commodity bear market ended with a shift in the global monetary system and a devaluation in the dollar that stimulated resources. The implications will be profound for many asset classes. However, history suggests the biggest beneficiaries will be commodities and their various producers. Investors must be aware and seek to protect themselves.
Intrigued? We invite you to download or revisit our entire Q1 2023 research letter, available below.

Registration with the SEC should not be construed as an endorsement or an indicator of investment skill, acumen or experience. Investments in securities are not insured, protected or guaranteed and may result in loss of income and/or principal. Historical performance is not indicative of any specific investment or future results. Investment process, strategies, philosophies, portfolio composition and allocations, security selection criteria and other parameters are current as of the date indicated and are subject to change without prior notice. This communication is distributed for informational purposes, and it is not to be construed as an offer, solicitation, recommendation, or endorsement of any particular security, products, or services. Nothing in this communication is intended to be or should be construed as individualized investment advice. All content is of a general nature and solely for educational, informational and illustrative purposes. This communication may include opinions and forward-looking statements. All statements other than statements of historical fact are opinions and/or forward-looking statements (including words such as “believe,” “estimate,” “anticipate,” “may,” “will,” “should,” and “expect”). Although we believe that the beliefs and expectations reflected in such forward-looking statements are reasonable, we can give no assurance that such beliefs and expectations will prove to be correct. Various factors could cause actual results or performance to differ materially from those discussed in such forward-looking statements. All expressions of opinion are subject to change. You are cautioned not to place undue reliance on these forward-looking statements. Any dated information is published as of its date only. Dated and forward-looking statements speak only as of the date on which they are made. We undertake no obligation to update publicly or revise any dated or forward-looking statements. Any references to outside data, opinions or content are listed for informational purposes only and have not been independently verified for accuracy by the Adviser. Third-party views, opinions or forecasts do not necessarily reflect those of the Adviser or its employees. Unless stated otherwise, any mention of specific securities or investments is for illustrative purposes only. Adviser’s clients may or may not hold the securities discussed in their portfolios. Adviser makes no representations that any of the securities discussed have been or will be profitable. Indices are not available for direct investment. Their performance does not reflect the expenses associated with the management of an actual portfolio.