
The article below is an excerpt from our Q2 2023 commentary.
Why has uranium rallied while every other energy commodity has collapsed?
Over the past twelve months, spot uranium advanced 12% while oil, natural gas, and coal all fell anywhere from 30-70%. Our models suggest uranium’s strong performance has just started.
Uranium has likely reached a pivotal inflection point that could force the price higher by as much as three- to four-fold over the next several years. For the first time in history, uranium has slipped into a persistent and widening deficit. We believe the results will be dramatic. Uranium is much less transparent than other commodity markets; in this essay, we will help shed light on the forces driving uranium over the course of the decade.
From the start of the nuclear age in 1945 until 2019, the uranium industry has gone through four distinct periods. Each period has been unique in terms of supply and demand, leading to wild price swings that lasted decades. The market has now definitively entered its fifth major period, likely defined by persistent severe deficits.
Period 1: 1945-1969
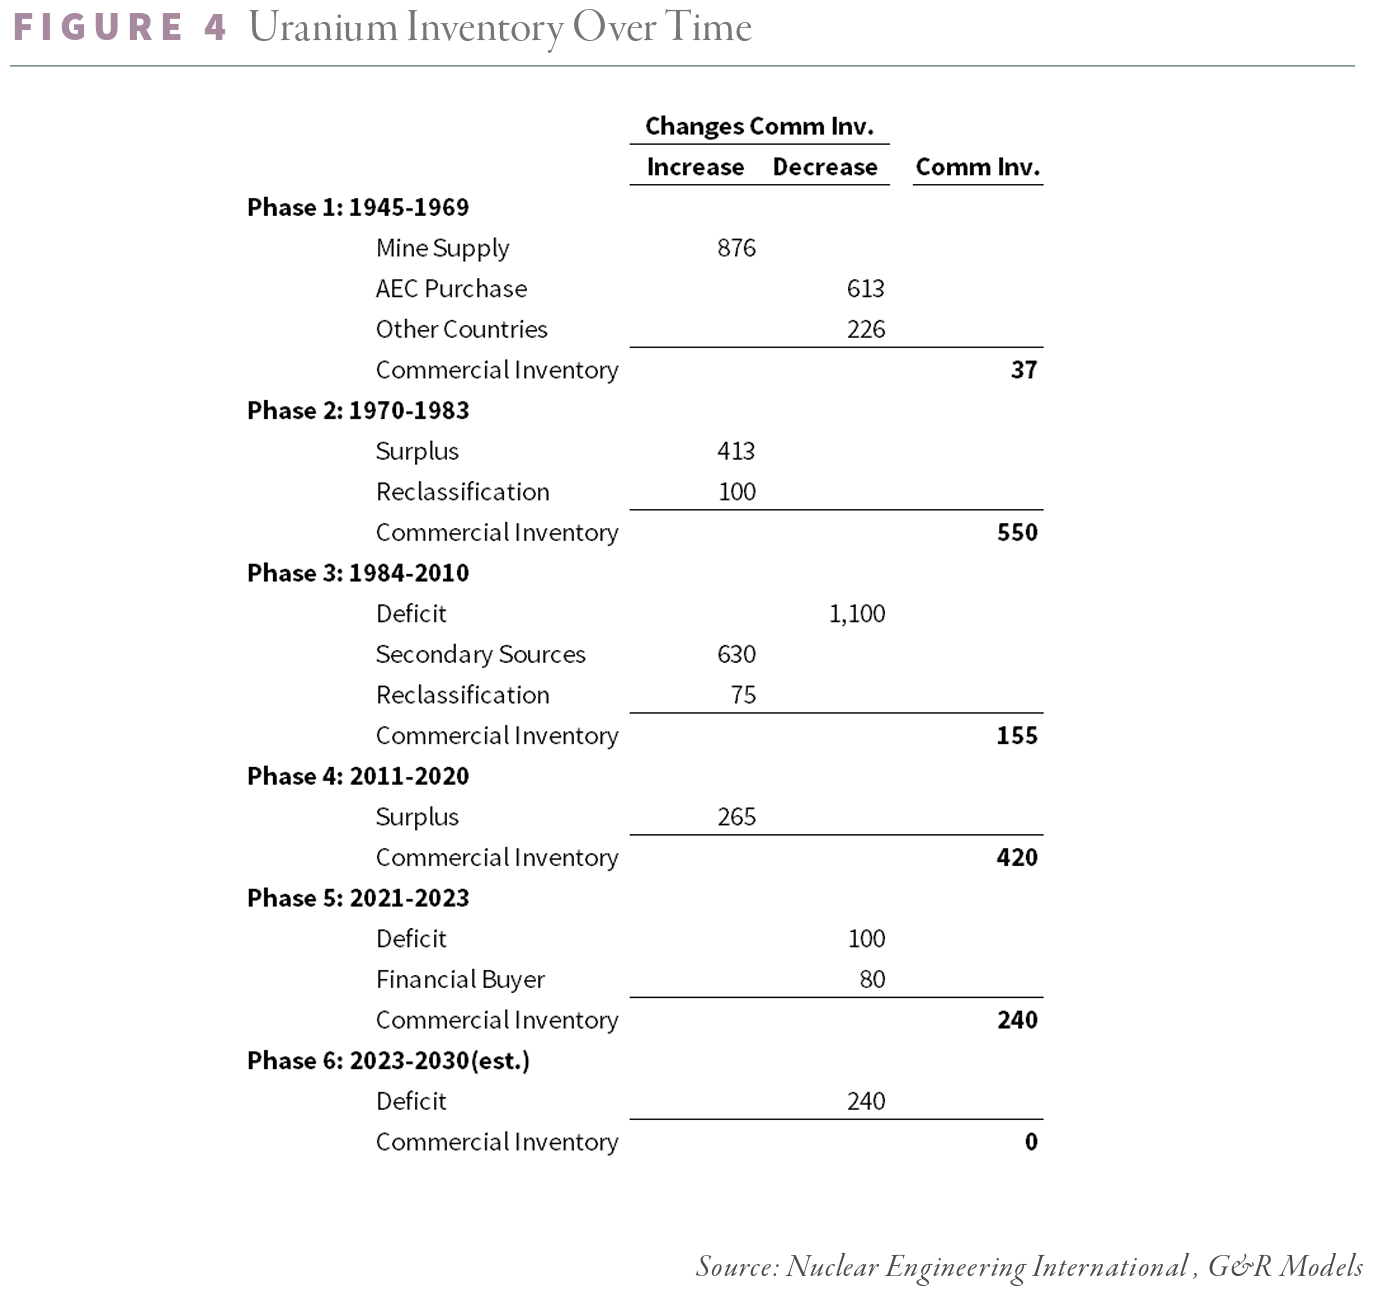
The first period took place between the mid-1940s and the late 1960s. Governmental stockpiling, for both weapons programs and nuclear power advancement, drove demand. Following the Trinity test in Los Alamos and the subsequent bombings of Hiroshima and Nagasaki in 1945, attention quickly turned to nuclear’s commercial applications. The USSR and England inaugurated the first two nuclear power stations in 1954 and 1956, with England’s being the first truly commercial reactor. Despite these early reactors, commercial demand remained extremely low. Throughout the Manhattan Project, a persistent shortage of uranium (along with enrichment bottlenecks), presented ongoing challenges. Protection of supply remained a pivotal point of national security after the war as first the US and then the USSR built up their atomic arsenals. Between 1945 and 1969, Nuclear Engineering International estimates global uranium mine supply totaled 900 mm lbs of triuranium octoxide (U3O8). Roughly half of this material was purchased by the US Atomic Energy Commission (AEC), while 40 mm lbs was purchased by the nascent commercial nuclear energy industry. Although the remaining 226 mm lbs was officially unaccounted for, it likely made its way to a combination of American, British, French, and Soviet government stockpiles.
Period 2: 1970-1983
The uranium market began to change in the early 1970s as commercial nuclear power gained adoption. Private sector utility buying became a dominant source of demand. Total installed capacity grew from 1 GWe in 1960 to 10 GWe by 1970 and 100 GWe by 1980. The arrival in earnest of the nuclear age also stoked a speculative boom in uranium mining. Production in the US peaked in 1980 at nearly 45 mm lbs of U3O8 per year. Despite the widespread adoption of nuclear power, mine supply actually grew faster than reactor demand throughout the decade. The 1970s were a period of rolling energy crises and insecurity. As a result, commercial buyers were more than happy to build up excess uranium inventories. From 1970 to 1983, mine supply exceeded reactor demand by 450 mm lbs of U3O8, all of which ended up in commercial inventories. Adding to the glut, the AEC reclassified approximately 100 mm lbs of its stockpiles from “governmental” to “commercial,” making it available to the nuclear power industry. By 1983, commercial inventories were 550 mm lbs – enough to cover reactor demand for nearly eight years. Prices peaked in 1982 at nearly $40 per pound and started a decades-long collapse.
Period 3: 1983-2010
Uranium mine supply peaked in 1982 and fell modestly during the decade. Reactor demand meanwhile grew robustly and finally exceeded mine supply in 1991. For the first time since the days of the Manhattan Project, uranium entered into a primary deficit. The deficit would persist for the next twenty-seven years, until the Fukushima incident. Unlike during the Manhattan Project, however, secondary sources of uranium filled the shortfall. Between 1983 and 2010, Nuclear Engineering International estimates reactor demand exceeded mine supply by an incredible 1.1 bn lbs of U3O8. Mine supply fell by nearly half from 170 mm lbs in 1982 to a plateau of 75 mm lbs by 1995. Reactor demand was nearly the mirror image, growing from 65 to 175 mm lbs over the 27-year period. Secondary supply made up the shortfall.
In 1993, Russia and the US entered into the so-called “Megatons for Megawatts” program, through which Russia pledged to decommission 20,000 nuclear warheads and convert the highly enriched uranium into 15,000 tonnes of low-enriched uranium suitable for manufacturing into reactor fuel. Russia also sold additional material outside of the program to provide much-needed funding following the collapse of the Soviet Union. Fuel recycling became widespread in the UK and France during this period as well, as did enrichment-tailing reprocessing. Secondary sources supplied a combined 630 mm lbs of U3O8-equivalent between 1983 and 2010. Commercial inventory destocking contributed another 500 mm lbs. The Department of Energy (the successor to the AEC), reclassified another 75 mm lbs of U3O8 from governmental to commercial, adding more material to the commercial market. All of this secondary supply put extreme downward pressure on uranium. Prices bottomed at $7.10 per pound in 2000.
By the mid-2000s, commercial inventories had fallen dramatically. The Russian disarmament program was due to expire in 2013, threatening to reduce secondary supplies materially. Uranium began to firm in 2003; by 2005 the price had tripled from $7 to $21 per pound. By the late 2000s, commercial inventories had fallen nearly 70% and stood at only 200 mm lbs. Commercial inventory coverage went from eight years in 1983 to less than two years by 2007. Utility buyers scrambled and speculators swooped in.
Spot prices reached a high of $136 per pound in June 2007, with long-term contracts settling at $95 per pound: an increase of between twelve- and eighteen-fold in seven years. Uranium collapsed during the Global Financial Crisis, but resumed its rally in 2010. By February 2011, uranium was once again over $70 per pound and commercial inventories stood at a mere 150 mm lbs.
Period 4: 2011-2020
On March 11 2011, the Tohoku earthquake and tsunami led to a partial meltdown of Japan’s Fukushima Daishi reactor. Japan shut down all its nuclear reactors over the next several years. European demand, led by German decommissioning, fell by 25%. Global reactor demand fell sharply from 182 mm to 150 mm lbs between 2010 and 2012 before beginning a slow recovery. Meanwhile, responding (with a lag) to the prior uranium boom, primary supply grew for the first time in decades. In-situ leach production in Kazakhstan grew by nearly 50%, or 20 mm lbs, between 2010 and 2016. Primary production nearly satisfied reactor demand in 2015 – a first in over twenty-five years.
Secondary supplies weighed on the market as well. Although the Russian disarmament program ended in 2013, tailings reenrichment, DOE surplus sales, recycling and underfeeding continued to contribute as much as 40 mm lbs of U3O8-equivalent by 2016.
Between 2011 and 2018, the uranium market was in surplus by 265 mm lbs., all of which ended up in commercial inventories. Commercial stockpiles, which started the period at a record-low 150 mm lbs., reached 415 mm lbs. by 2018, covering reactor demand for three years.
We became interested in uranium producers this cycle in late 2017, when Cameco announced they would curtail production at its flagship MacArthur River Mine. Kazatomprom followed suit, announcing it would curtail production. Our models told us these cuts would push reactor demand firmly above total supply, including secondary sources. In retrospect, we were correct. Commercial inventories peaked in 2018 and declined slightly in 2019 and 2020. The era of persistent deficits had started.
The uranium price meanwhile remained depressed, averaging less than $25 per pound between 2016 and 2020.
Period 5: 2021-Present
Uranium’s structural deficit has accelerated dramatically since 2021. Reactor demand bottomed in 2020 at 161 mm lbs of U3O8 and is expected to reach 188 mm lbs this year. After spending a decade decommissioning its nuclear reactors, Europe and the US appear to have finally reversed course. We have long argued that wind and solar simply cannot provide efficient base-load carbon-free electricity. We warned that grid instability and energy insecurity would soon follow. Russia’s invasion of Ukraine in 2022 put Europe’s natural gas supply at risk, bringing renewables’ shortcomings to the fore. Primary uranium production remained depressed through 2022 at 120 mm lbs – a multi-decade low. Secondary supply averaged only 22 mm lbs. leaving a deficit of nearly 30 mm lbs in 2021 and 2022.
A new source of demand burst onto the scene in 2021 as well: the financial buyer. Led by the Sprott Physical Uranium Trust, financial vehicles have acquired between 25 and 30 mm lbs each year in 2021 and 2022. Unlike open-ended funds such as the GLD, the financial uranium vehicles are closed-ended, meaning the material cannot readily flow back into the commercial market. Once material is purchased it is permanently locked up.
As a result, the uranium market experienced a deficit of nearly 180 mm lbs between 2020 and 2023. The deficit was met by materially depleting the commercial inventories that had accumulated following Fukushima. By the end of this year, we expect commercial inventories will be back to 250 mm lbs, covering reactor demand by less than 18 months. The last time commercial inventories reached these levels in the mid-2000s, prices spiked to their all-time highs of $145 per pound. We expect the same now.
Looking to the end of the decade, global uranium markets are set to tighten to unprecedented levels. Looking only at nuclear power plants that are currently under construction, reactor demand is set to grow from 188 to 240 mm lbs by 2030. If every uranium-producing country gets back to its maximum output (a big if), primary production will only grow from 140 to 174 mm pounds by 2030. Assuming secondary supply stays flat at 20 mm lbs per year, the annual uranium market deficit will grow from 27 to 45 mm lbs by the end of the decade, before factoring in further financial buying. The cumulative deficit between 2023 and 2030 will likely exceed 250 mm lbs, completely depleting all commercial stockpiles.
These figures are likely too conservative. There are presently fifty-nine reactors under construction with a total capacity of 66 GWe. Every new reactor requires three years of uranium fuel for its initial core loading. We believe this will consume an additional 60 mm lbs of U3O8 between now and 2030. Over the past twenty years, new reactors have been mostly offset by retirements. When a reactor is decommissioned, it is able to harvest its final core loading without requiring a replacement. Therefore, new reactor loadings have been offset by retiring old reactors. This will not be possible going forward.
Furthermore, financial accumulation is likely to accelerate once speculators realize the small size of the market and the precarious commercial inventory situation. How large financial buying can get is an open question, however adding another 100 mm lbs of U3O8 would only cost $6 bn and would dramatically tighten balances even further.
Utilities remain dramatically under-contracted post-2025. Fuel buyers have been very complacent in recent years, due to the persistent commercial inventory overhang following Fukushima. Simply put, it has paid to wait to secure supplies. That dynamic is quickly changing as fuel buyers feel insecure and under-covered for the first time in nearly fifteen years. Although it is an opaque market, all signs point to uranium entering into a sustained and frenetic bull market. Prices have rallied from a 2018 low of $18 to nearly $60 per pound already. However, even at these prices, it is unlikely many new greenfield uranium deposits can be economically developed.
The uranium industry has been dramatically starved of capital for many years. In our view, the persistent bear market – in many ways present since the 1980s with only a single reprieve – is over. Investors should act accordingly.
Intrigued? We invite you to download or revisit our entire Q2 2023 research letter, available below.

Registration with the SEC should not be construed as an endorsement or an indicator of investment skill, acumen or experience. Investments in securities are not insured, protected or guaranteed and may result in loss of income and/or principal. Historical performance is not indicative of any specific investment or future results. Investment process, strategies, philosophies, portfolio composition and allocations, security selection criteria and other parameters are current as of the date indicated and are subject to change without prior notice. This communication is distributed for informational purposes, and it is not to be construed as an offer, solicitation, recommendation, or endorsement of any particular security, products, or services. Nothing in this communication is intended to be or should be construed as individualized investment advice. All content is of a general nature and solely for educational, informational and illustrative purposes. This communication may include opinions and forward-looking statements. All statements other than statements of historical fact are opinions and/or forward-looking statements (including words such as “believe,” “estimate,” “anticipate,” “may,” “will,” “should,” and “expect”). Although we believe that the beliefs and expectations reflected in such forward-looking statements are reasonable, we can give no assurance that such beliefs and expectations will prove to be correct. Various factors could cause actual results or performance to differ materially from those discussed in such forward-looking statements. All expressions of opinion are subject to change. You are cautioned not to place undue reliance on these forward-looking statements. Any dated information is published as of its date only. Dated and forward-looking statements speak only as of the date on which they are made. We undertake no obligation to update publicly or revise any dated or forward-looking statements. Any references to outside data, opinions or content are listed for informational purposes only and have not been independently verified for accuracy by the Adviser. Third-party views, opinions or forecasts do not necessarily reflect those of the Adviser or its employees. Unless stated otherwise, any mention of specific securities or investments is for illustrative purposes only. Adviser’s clients may or may not hold the securities discussed in their portfolios. Adviser makes no representations that any of the securities discussed have been or will be profitable. Indices are not available for direct investment. Their performance does not reflect the expenses associated with the management of an actual portfolio.