
Prefer to listen to this article? Please click the play button above.
The article below is an excerpt from our Q2 2024 commentary.
We first unveiled this chart (shown below) in our 1Q2019 letter and have since revisited it many times. It’s a chart of unassuming elegance, plotting nothing more than the ratio of a commodity total return index against the Dow Jones Industrial Average. The origins of this chart trace back to Jeffrey Gundlach of DoubleLine Capital, who in turn may have drawn inspiration from a similar chart published by Tony Boeckh, the astute founder of BCA Research and Alpine Macro.
Mr. Gundlach’s chart plotted the relationship between commodities and stocks from the inception of the GSCI Commodity Index in 1970. But our curiosity took us further back. We wanted to see how this relationship fared in earlier periods, so we painstakingly constructed our own commodity total return index dating back to 1900, using the same methodology as the GSCI. Our findings were revelatory: commodities and common equities do indeed move in long cycles, often as mirror images of one another. This cyclical nature leads to distinct periods when commodities are glaringly undervalued relative to equities—moments when commodities present tremendous investment opportunity -- and others when they were expensive and best avoided.
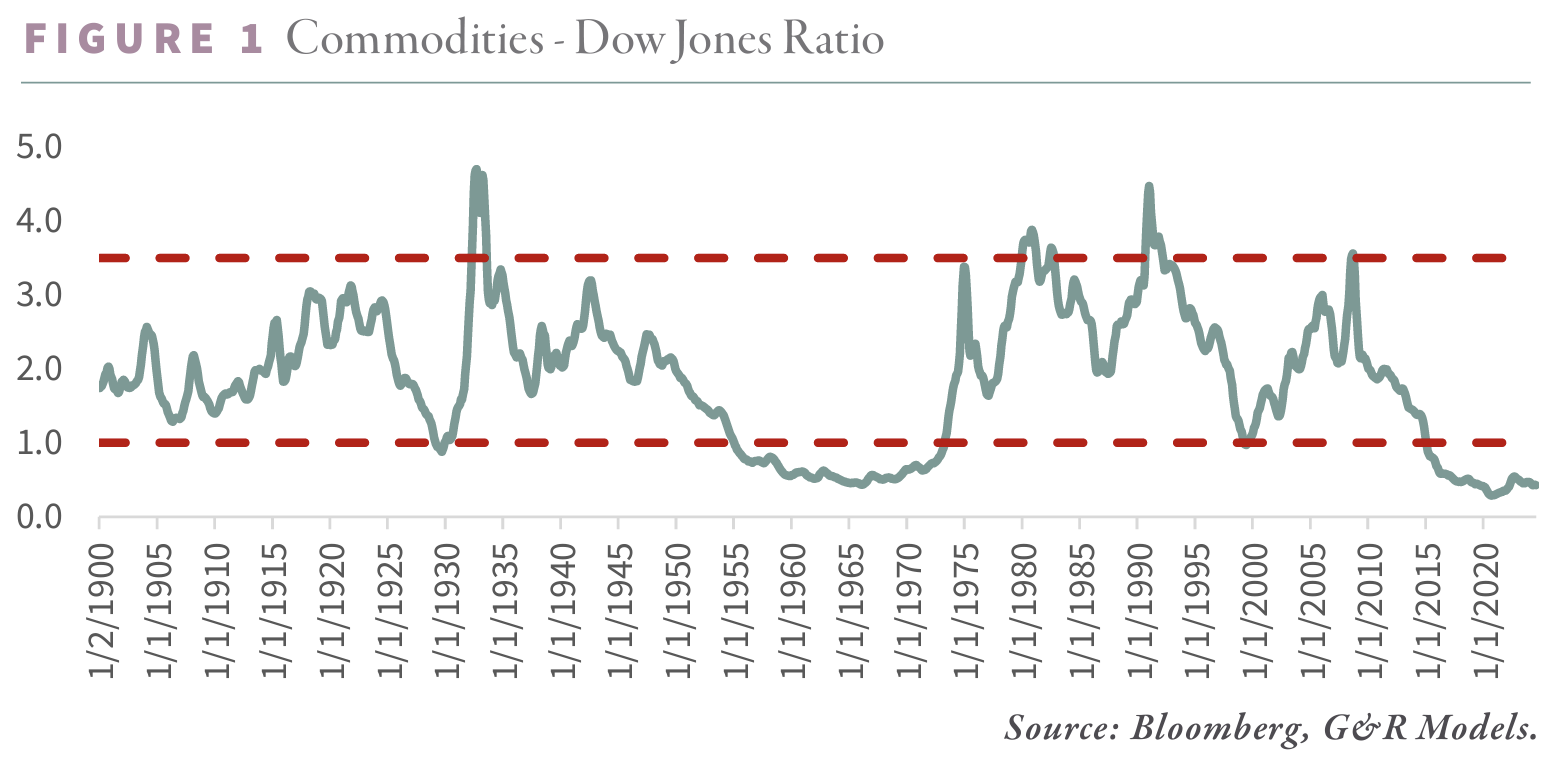
Over the past 125 years, commodities have reached these points of extreme undervaluation relative to equities on four notable occasions: 1929, 1969, 1999, and most recently, 2020. After each of the first three lows, commodities and natural resource equities went on to dramatically outperform the broader market, and we suspect history is poised to repeat itself.
A closer examination of these periods reveals several consistent patterns. First, commodities tend to perform dismally in the lead-up to these inflection points, often plummeting by 50% or more. Second, these periods of commodity despair are invariably accompanied by a stock market mania—whether it was the broad market euphoria of the 1920s, the Nifty Fifty craze of the late 1960’s and early 1970’s, the dot-com bubble of the 1990s, or the dominance of Big Tech in the 2010s. Dual forces -- falling commodity prices on one side, and exuberant equity markets on the other -- drive the commodity-to-equity ratio to extremes.
Third, each instance of extreme commodity undervaluation was preceded by a period of easy money. Consider the 1920s, when the U.S. experimented with its first round of quantitative easing under Benjamin Strong. Or the 1960s, with President Johnson’s “Guns and Butter” policies. Then there was the Greenspan era in the 1990s, marked by ever-looser monetary policy despite robust economic conditions. Following the Global Financial Crisis, central banks around the world printed money with a reckless abandon never seen before, expanding their balance sheets to unprecedented levels. This excess liquidity only served to push commodity prices lower and equity prices higher, driving our ratio from cheap to extreme.
Fourth, as commodities fell out of favor and equities soared, capital was diverted away from new mining and energy projects, ultimately impacting supply just as demand remained strong. Eventually, this supply-demand imbalance pushed commodity markets from surplus to deficit, sparking a period of strong absolute and relative returns for commodities and natural resource equities.
Finally, each of these inflection points coincided with a shift in the global monetary system. In 1930, the world bid farewell to the Classical gold standard after years of massive post-war instability. In 1968, President Johnson’s legislation effectively severed the U.S. dollar’s ties to gold, setting the stage for the Nixon’s “gold shock” and the eventual demise of Bretton Woods in 1971. And in 1999, the fallout from the Asian currency crisis led to a wave of emerging market currencies being pegged to the U.S. dollar at artificially low levels--- a move that Russell Napier has called the “No Name Revolution,” with consequences as profound as the end of the Gold Standard or Bretton Woods.
Today, commodities are as undervalued relative to common equities as they have ever been. The 2010s saw a decade of commodity weakness, while equities, since the Global Financial Crisis, have entered an almost perpetual bubble. Central banks have printed more money in recent years than at any time in human history. Investor capital has fled the commodity sector, and corporate spending in the natural resource sector remains at near record lows. Meanwhile, the U.S. dollar’s dominance in international trade is being challenged, with countries rushing into gold as a potential hedge against its reserve currency status. All signs point to the early stages of a prolonged commodity bull market, likely stretching into the 2030s.
Yet, the future trajectory of this bull market remains uncertain. The sharp rebounds experienced in 1929 and 1999 now seem unlikely. In contrast, it now seems we are entering a protracted period of extreme undervaluation like the 1950s and 1960s. So far, the current cycle seems to be echoing the latter, with the commodity-to-Dow ratio remaining below 0.5 nearly a decade after first breaking 1:1 in 2015.
Which brings up the inevitable question: should investors allocate capital to natural resources markets if we are about to repeat the experience of the 1950’s and 1960’s— a period where commodities remained radically undervalued for over 15 years? The answer to this question is simple and profound: when commodities and natural resource equities are deeply undervalued such as they were in the mid- 1950’s, the cost of buying into these markets is surprisingly low—if it exists at all. Indeed, the greater danger to long-term performance lies in showing up late to the commodity bull market party. Investor concern, although easy to understand, overlooks what actually happened during that 15-year period--as you shall see.
Our analysis, based on data from Professor Kenneth French, led us to create a natural resource equity index* consisting of an equally weighted portfolio composed of energy, gold, base metal, and agricultural equities, rebalanced annually. We scrutinized how this portfolio performed at each market bottom and assessed the impact of early entry on overall returns. The findings are illuminating.
In early 1929, just as the broad market was reaching its zenith and natural resource equities were plumbing their depths, the commodity-to-Dow ratio breached 1:1. An investor who had the foresight to buy the natural resource equity basket at that moment would have doubled their money between April 1929 and April 1937. Meanwhile, those invested in the Dow or S&P 500 would have suffered losses of 45% and 35%, respectively. Natural resource equities delivered an impressive 9% annual return during this period, far outpacing the broad market’s dismal performance. Importantly, being early was not an issue —the ratio broke one in April 1929, bottomed only a few months later and quickly started rallying. Despite the inherent economic sensitivity of natural resource stocks, their maximum drawdown was 68% between 1929 and 1937, a far cry from the near 90% drawdown experienced by the Dow and S&P 500.
The story repeated itself in 1999. Once again, being early proved inconsequential: the commodity-to-Dow ratio first broke 1:1 in April before bottoming months later and rallying. Natural resource equities surged 344% between April 1999 and May 2011, while the Dow and S&P 500 posted gains of only 57% and 28%, respectively. On an annualized basis, natural resource equities rose by 13%, outperforming the Dow and S&P 500 by a staggering 9% and 11% per year respectively.
The 1954 to 1980 period was more complicated. In December 1954, the commodity-to-Dow ratio breached the 1:1 threshold, a moment that might have signaled a bottom. Yet, rather than rallying as one might expect, the ratio meandered lower, descending over the next eleven years to a low of 0.4 by February 1966. Even then, the awaited rally did not materialize with any vigor, instead lingering in a range until finally breaking higher in 1970. By 1981, however, the ratio had soared to a remarkable 4:1—one of the loftiest readings on record.
While the commodity-to-Dow ratio continued its descent during the subsequent decade, commodity prices themselves did not stand still. Between December 1954 and January 1970, commodities advanced by 25%—a modest gain, to be sure, yet upward progress nonetheless. Natural resource equities, meanwhile, benefitted from investor neglect, and their depressed valuations offered investors tremendous opportunity. From December 1954 to January 1970 the basket of natural resource stocks delivered a total return of 320% during this period, outpacing both the Dow and the S&P 500, which rose by 135% and 294%, respectively. On an annualized basis, the resource stock basket returned 10.0%, comfortably ahead of the Dow’s 5.8% and the S&P 500’s 9.5%.
Being early, as it turns out, was no disadvantage. Yes, the ride was bumpy—the maximum drawdown for our commodity stock basket was a daunting 36% in late 1957, compared with 22% for the Dow and S&P 500 in 1962. Yet, for those with the fortitude to weather the volatility, the rewards were substantial.
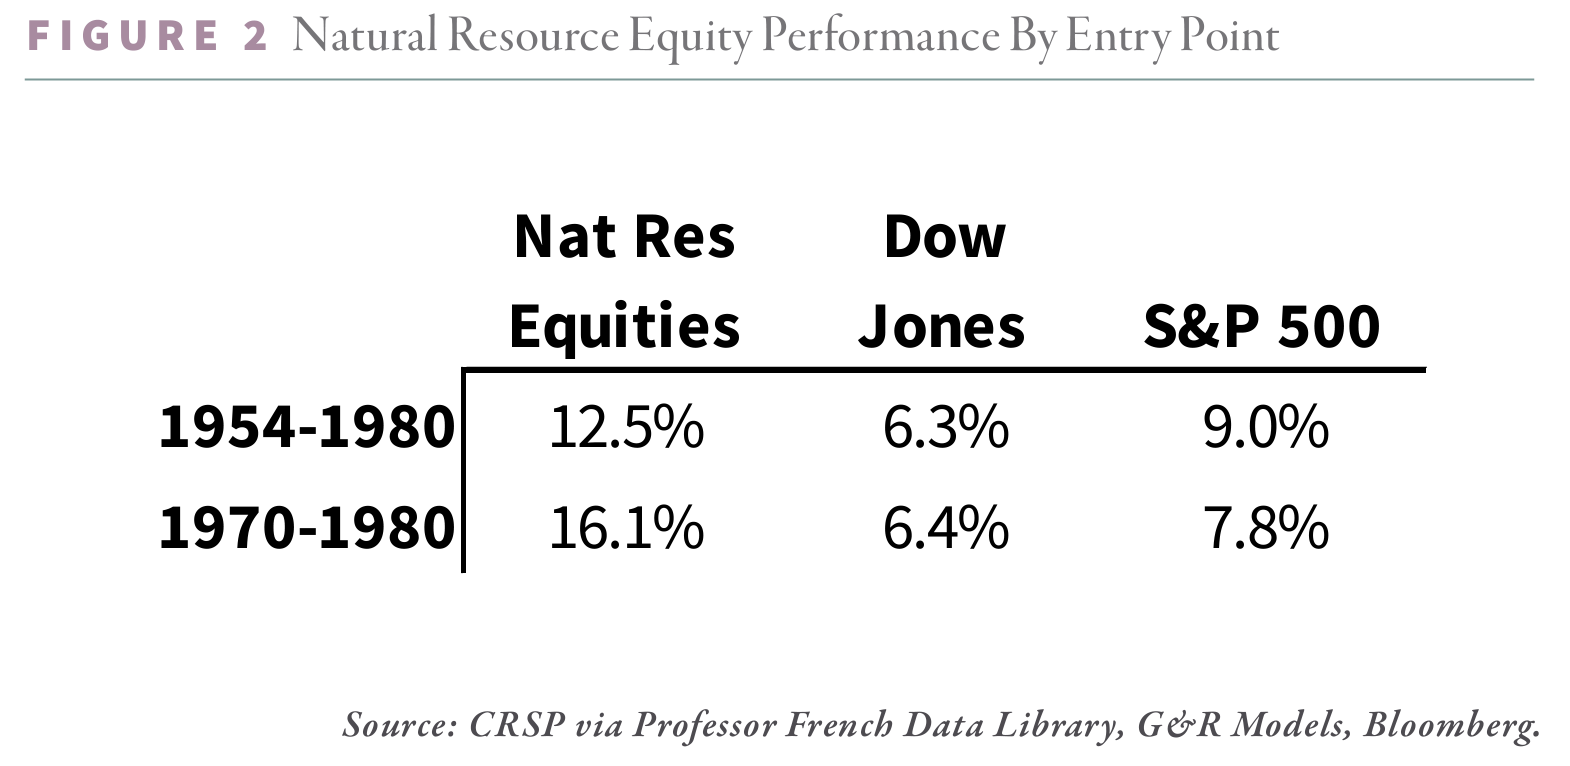
From 1970 to 1980, as commodities surged, natural resource equities truly came into their own, quintupling in value with a 16% annual return. By contrast, the Dow and S&P 500, with gains of 93% and 122%, respectively, advanced at an annual clip of 6.4% and 7.8%— both trailing resource equities by significant amounts.
Viewed from the broader perspective of 1954 to 1980, the investor who stepped in when the commodity-to-Dow ratio first broke one in 1954 would have achieved a staggering 2,000% return, or 12.5% annually. The Dow, for all its “blue chip” luster, advanced by a comparatively modest 385%, or 6.3% annually, while the S&P 500 rallied 828%, or 9.0% annually. In relative terms, the natural resource investor outperformed the Dow by 6.2% and the S&P by 3.5% annually.
Had an investor possessed the foresight to wait until 1970, when commodities were poised for a spectacular surge, they would have enjoyed a 16% annual return for the ensuing decade, besting the indices by 9% per year. However, even for those who were “extremely early” and bought natural resource stocks in 1954, the result was still impressive—a 12.5% annual return by 1980, surpassing the indices by nearly 5% annually. Notably, during the 15-year lead-up to the commodity turn, they would have outperformed both the Dow and the S&P 500. The cost of being early, as it turns out, was not a cost at all.
Ironically, we believe the biggest risk is in being late. Waiting until 1970 would have meant missing half of the rally. Had an investor chosen the Dow from 1954 until 1970 and then presciently switched to commodity stocks, his total cumulative return would have been half of what it would have been if he had simply bought commodity stocks early. Had he instead chosen the S&P 500 before changing course adeptly in 1970, his return would still have trailed. Factoring in the realized capital gains impact of rotating from the S&P to resource stocks, of course, makes our case much stronger.
Fast forward to our current cycle, where the commodity-to-Dow ratio first broke 1:1 in 2015. Since then, the ratio has reached an all-time low: hitting 0.3 in September 2020. Once again, the feared cost of being early has proven to be minimal. Since 2015, the natural resource equity portfolio—equally weighted between energy, base metals, precious metals, and agriculture-- has returned 175%, or 11.3% annually—keeping pace with the Dow and only slightly trailing the S&P 500.
Since the ratio’s bottom in 2020, natural resource portfolios have performed even better, advancing 140%, or 23% annually, compared with 95% and 126% for the Dow and S&P, respectively.
We believe today’s present cycle mirrors that of 1954-1980 in many respects. Commodities first became radically undervalued in 1954 when the ratio broke the 1:1 mark, only to take years to bottom in 1966 and several more before beginning their outperformance in 1970. Similarly, in this cycle, the ratio first broke 1:1 in 2015 and bottomed six years later at 0.3 in 2020. Now, nearly four years past that bottom—akin to where we were in 1970—we believe commodities are poised to begin radically outperforming once more.
In both periods, the fear of being early was misplaced—there was no cost associated with being early. And, as we just discussed, we believe the present cycle is shaping up to be no different.
And so, we return to the perennial question: what is the cost of being early? If history is any guide, the cost is, at worst, negligible, and at best, a gateway to outsized returns. The real peril lies in hesitating--waiting for the perfect moment that may never come.
Intrigued? We invite you to download or revisit our entire Q2 2024 research letter, available below.
Join us for 2024 INVESTOR DAY on October 21. "Geopolitics, War, and Commodities". Both in-person and virtual options are available. To register or learn more: https://conference.gorozen.com.

Disclosures:
The commodity total return index cannot be invested in and is constructed by G&R for illustrative purposes only.
Registration with the SEC should not be construed as an endorsement or an indicator of investment skill, acumen or experience. Investments in securities are not insured, protected or guaranteed and may result in loss of income and/or principal. Historical performance is not indicative of any specific investment or future results. Investment process, strategies, philosophies, portfolio composition and allocations, security selection criteria and other parameters are current as of the date indicated and are subject to change without prior notice. This communication is distributed for informational purposes, and it is not to be construed as an offer, solicitation, recommendation, or endorsement of any particular security, products, or services. Nothing in this communication is intended to be or should be construed as individualized investment advice. All content is of a general nature and solely for educational, informational and illustrative purposes. This communication may include opinions and forward-looking statements. All statements other than statements of historical fact are opinions and/or forward-looking statements (including words such as “believe,” “estimate,” “anticipate,” “may,” “will,” “should,” and “expect”). Although we believe that the beliefs and expectations reflected in such forward-looking statements are reasonable, we can give no assurance that such beliefs and expectations will prove to be correct. Various factors could cause actual results or performance to differ materially from those discussed in such forward-looking statements. All expressions of opinion are subject to change. You are cautioned not to place undue reliance on these forward-looking statements. Any dated information is published as of its date only. Dated and forward-looking statements speak only as of the date on which they are made. We undertake no obligation to update publicly or revise any dated or forward-looking statements. Any references to outside data, opinions or content are listed for informational purposes only and have not been independently verified for accuracy by the Adviser. Third-party views, opinions or forecasts do not necessarily reflect those of the Adviser or its employees. Unless stated otherwise, any mention of specific securities or investments is for illustrative purposes only. Adviser’s clients may or may not hold the securities discussed in their portfolios. Adviser makes no representations that any of the securities discussed have been or will be profitable. Indices are not available for direct investment. Their performance does not reflect the expenses associated with the management of an actual portfolio.