
Often at the bottom of intense, grinding bear markets or the top of bull markets, investors will create a narrative to help explain the extreme price action. Today, the prevailing consensus view is that oil market fundamentals are bad and getting worse. Most analysts believe the market is currently in surplus and that this surplus will accelerate as weak demand is met by ever-growing shale production. At the same time, the electric vehicle (EV) threat looms and is expected to leave oil worthless within several years. This outlook appears to be corroborated by the sell-off in E&P stocks, reinforcing the negative feedback loop.
Oil Prices, Trailing 10 Years
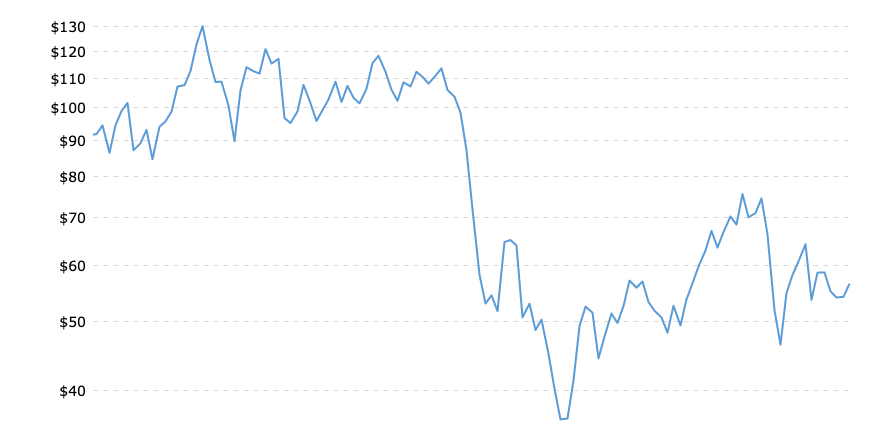
Source: Macrotrends.net
Unfortunately, the story investors have created to help explain today’s energy bear market is fundamentally incorrect. While it may be counterintuitive, the oil market is in deficit today and has been for nearly three years. After peaking at nearly 450 mm bbl above average, OECD inventories have repaired themselves by 75%. In the US (by far the largest source of OECD inventories), core inventories drew during the first nine months of 2019 by 40 mm bbl during a period that normally sees them build by 1.4 mm bbl. This implies the market was undersupplied by 150,000 b/d.
While the data for the OECD as a whole came in slightly weaker, it still suggested a balanced market for the first nine months of the year based upon preliminary data. We should point out that the IEA has been revising its most recent inventory data and so we will have to wait to see if the most recent data ends up being revised down from here. Both WTI and Brent markets remain firmly “backwardized,” confirming the market is indeed tight.
Investors remain very concerned about the impact of slowing economic growth on global oil demand. While Q2 did show some softening, there have been several very bullish developments that most investors seem to ignore. For example, analysts focused all of their attention on the IEA’s recent downward revision of 2020 global demand projections by 100,000 b/d over the course of the last three months. However, at the same time, the IEA quietly revised historical demand higher by 190,000 b/d in 2017 and 110,000 b/d in 2018–a fact that few people wrote about. Notably, Q4 of 2018 was revised higher by a very large 300,000 b/d.
Our models tell us that more revisions are forthcoming. As always, our analysis revolves around the “missing” barrels. For example, the IEA still claims after its latest set of historical revisions that global demand for all of 2018 equaled 99.3 mm b/d while total supply equaled 100.3 mm b/d. This suggests that inventories should have grown by 1 mm b/d or 365 mm b for the full year. Instead, the IEA reports that inventories were unchanged for the year. We refer to the “missing” barrels as oil that was produced but neither consumed nor put in storage. We have long argued that “missing barrels” are a clear indicator that the IEA will revise higher its demand figures and once again that has been correct.
The IEA has a long history of demand underestimation. In eight of the last nine years, they have been forced to revise global demand higher by 1.1 m b/d on average (a number that is creeping higher). Despite this chronic underestimation and the continued presence of “missing barrels,” investors continue to ignore the warning signs of stronger than expected demand.
For example, all of the headlines we’ve read focused on the small downward revisions to future demand projections (by an agency that systematically underestimates demand), while none have focused on the larger positive revision to actual historical data. If we are right and the majority of the “missing” barrels are eventually included in global demand, then 2018 demand likely averaged 100.4 m b/d or an incredible 2.2 m b/d higher than 2017. That is the largest annual growth in eight years.
Next week, we will dive into the supply side of the equation, including US shale growth that has rapidly slowed.
In our latest in-depth commentary, WHAT IS HAPPENING TO US SHALE PRODUCTION?, we explore this subject and many others. If you are interested in reading the document, download the full commentary here.
