
In a previous post, we talked about how over the last nine years, the largest source of U.S. natural gas supply growth has come from the Marcellus shale. The Marcellus produces 22.5 bcf/d, representing roughly a quarter of total US dry gas supply. This makes it the largest basin in the country by a wide margin.
An accurate prediction of when gas production from the Marcellus field will peak would be extremely useful in determining when the gas bear market might end. This week, we turn to our newly designed neural network for answers.
We became more motivated to undertake this project after meeting with multiple Marcellus operators. We always ask managements how much Tier 1 drilling acreage remains in their inventory. In the past, Marcellus operators would respond that they had decades and decades of Tier 1 acreage left to drill. However, the responses from these same companies’ have recently become more somber with some operators even suggesting their Tier 1 drilling inventories might be less than 10 years.
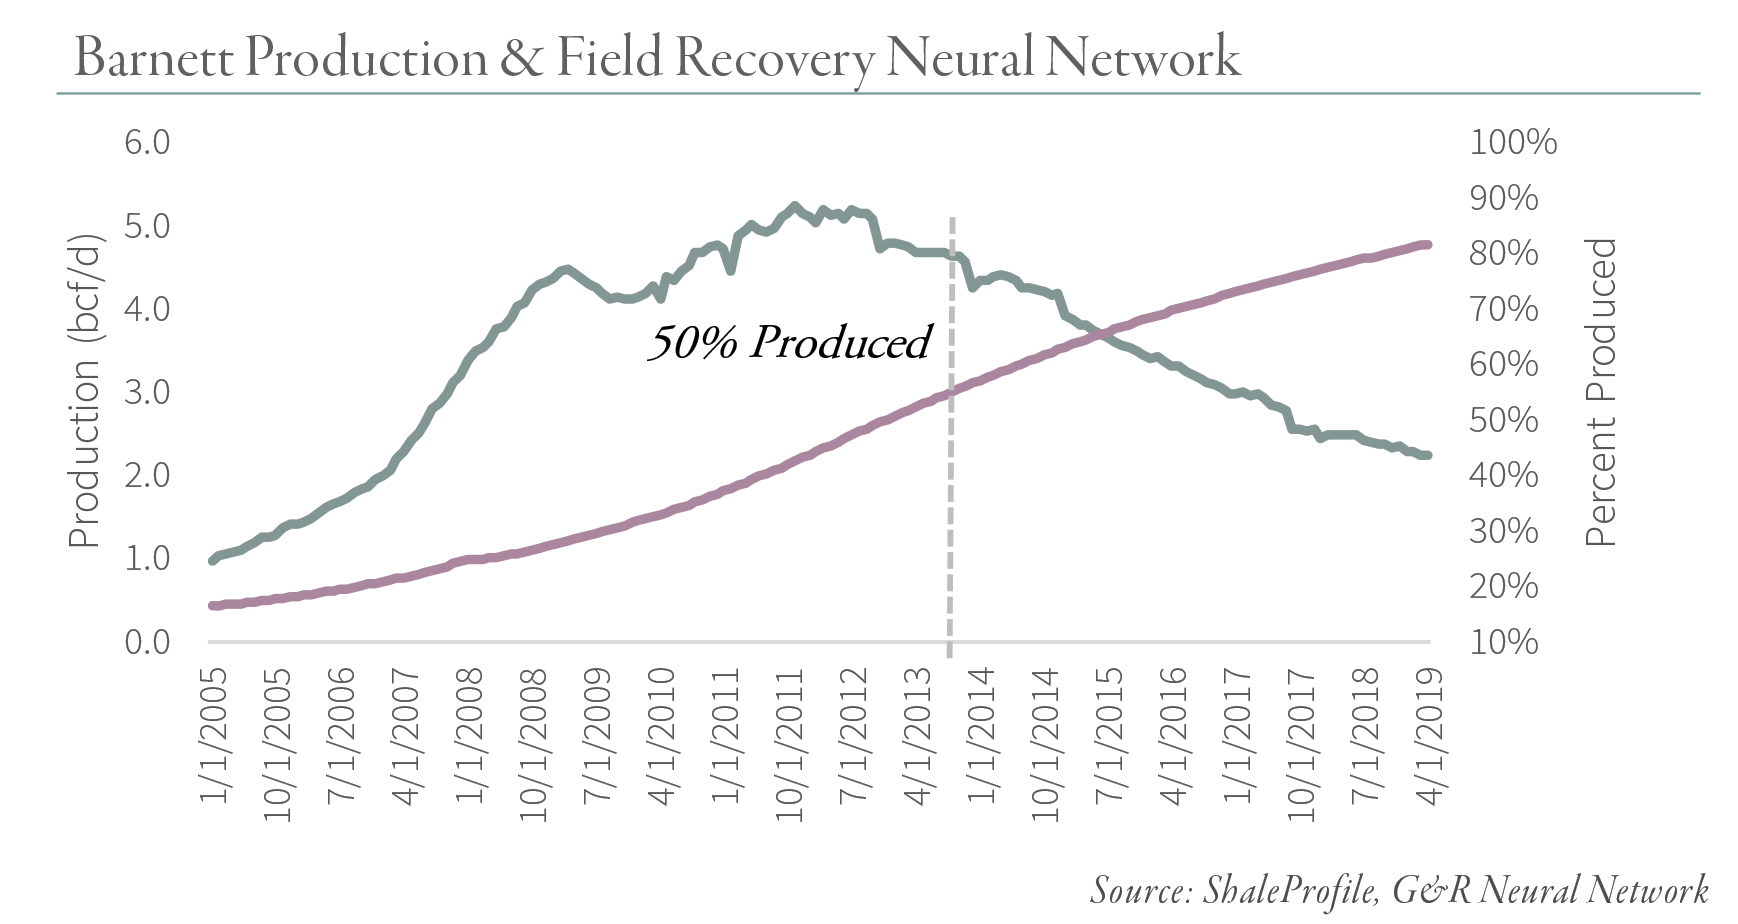
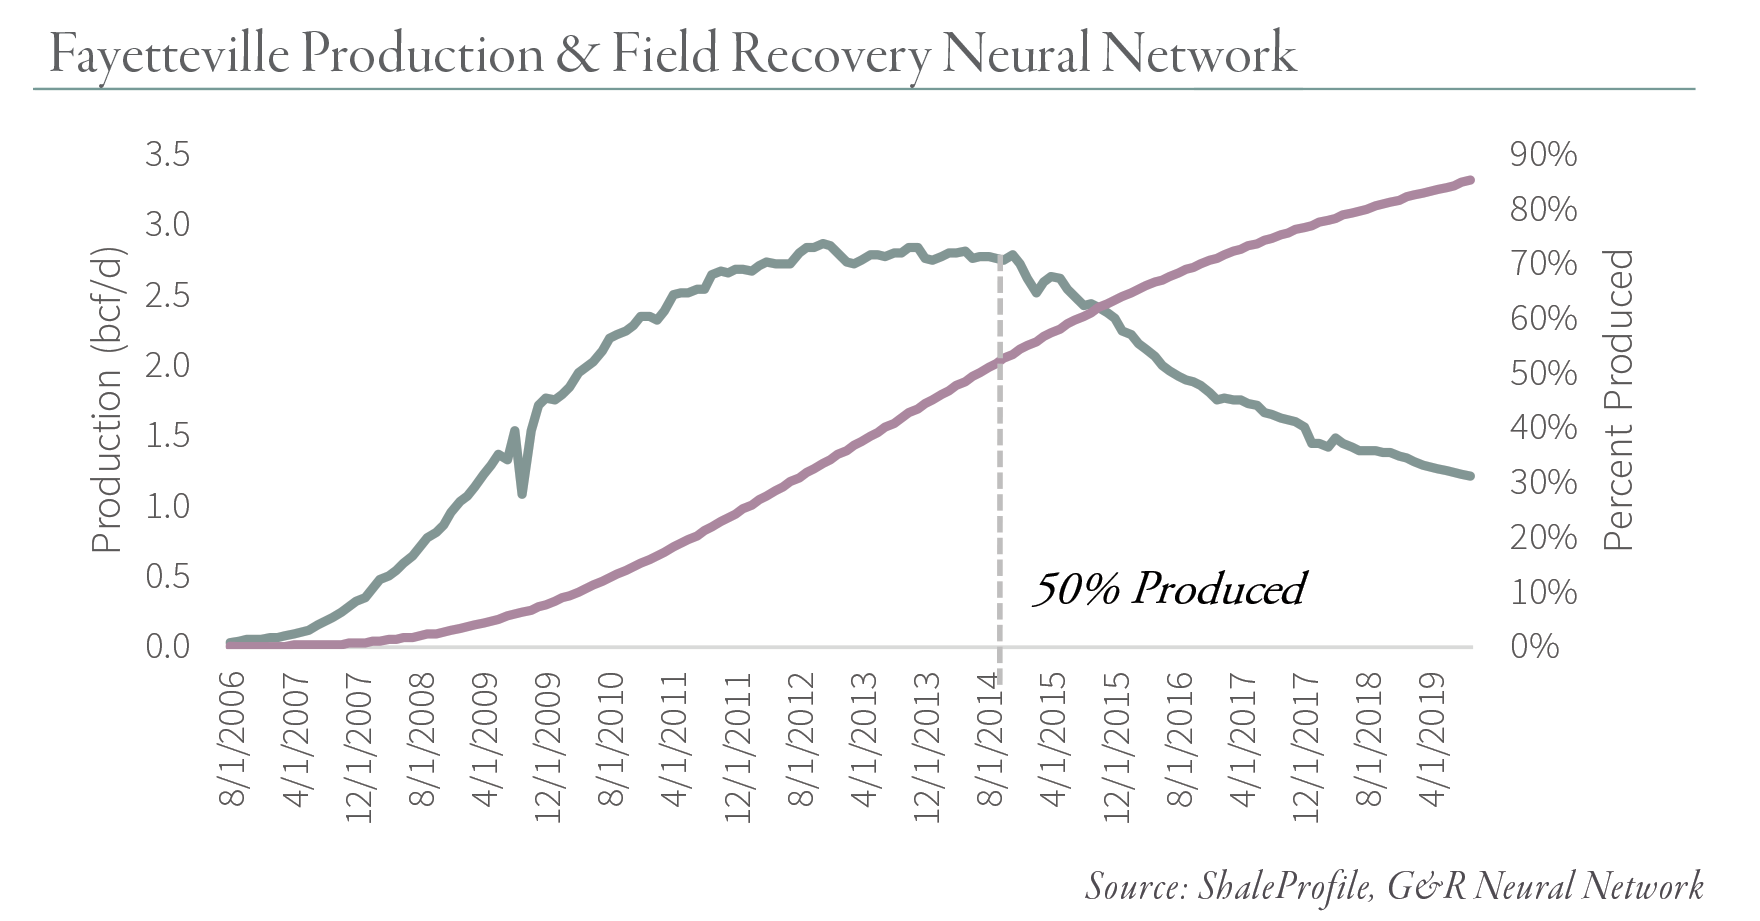
Before we discuss the Marcellus, let’s step back and analyze the production history of both the Barnett and Fayetteville fields -- the first two gas shales to be developed. Both fields have peaked and production has clearly rolled over. As you can see from the two charts below, both the Barnett and the Fayetteville have traced out near-perfect “Hubbert Curves.” The “Hubbert Linearization” suggests the Fayetteville will ultimately recover 9 tcf while the Barnett will recover 20 tcf.
We compared the Hubbert Linearization with the recoverable reserve estimation made by our neural network, and the results were remarkable. Our neural network identified 17,000 possible Barnett wells of which 15,000 have been drilled and completed. Total expected reserves from these 17,000 wells is expected to total 23 tcf of natural gas of which 20 tcf (or 85%) have already been produced. Unlike the Hubbert Linearization, our neural network identifies each individual well location making it very much a direct or “bottoms up” estimate. Remarkably, the neural network predicted that total recoverable reserves would be within 15% of the Hubbert Linearization. Moreover, according to the neural network, production from the Barnett peaked and rolled over within a few months of when half the recoverable reserves were produced.
Turning to the Fayetteville, our neural network identified just over 6,000 drilling locations of which 5,600 have been drilled to date. In total, our neural network estimated total recoverable reserves at 10 tcf of which 8.9 tcf have already been produced. Once again, our neural network (based on projections of individual wells) comes very close to the Hubbert Linearization, which projected 9 bcf of recoverable gas. Just like the Barnett, production from the Fayetteville seems to have peaked and rolled over within a few months of reaching the “half-way” point in terms of recoverable reserves. Our neural network tells us that 85% of the Fayetteville’s reserves have now been produced and that production has little to no chance of ever recovering.
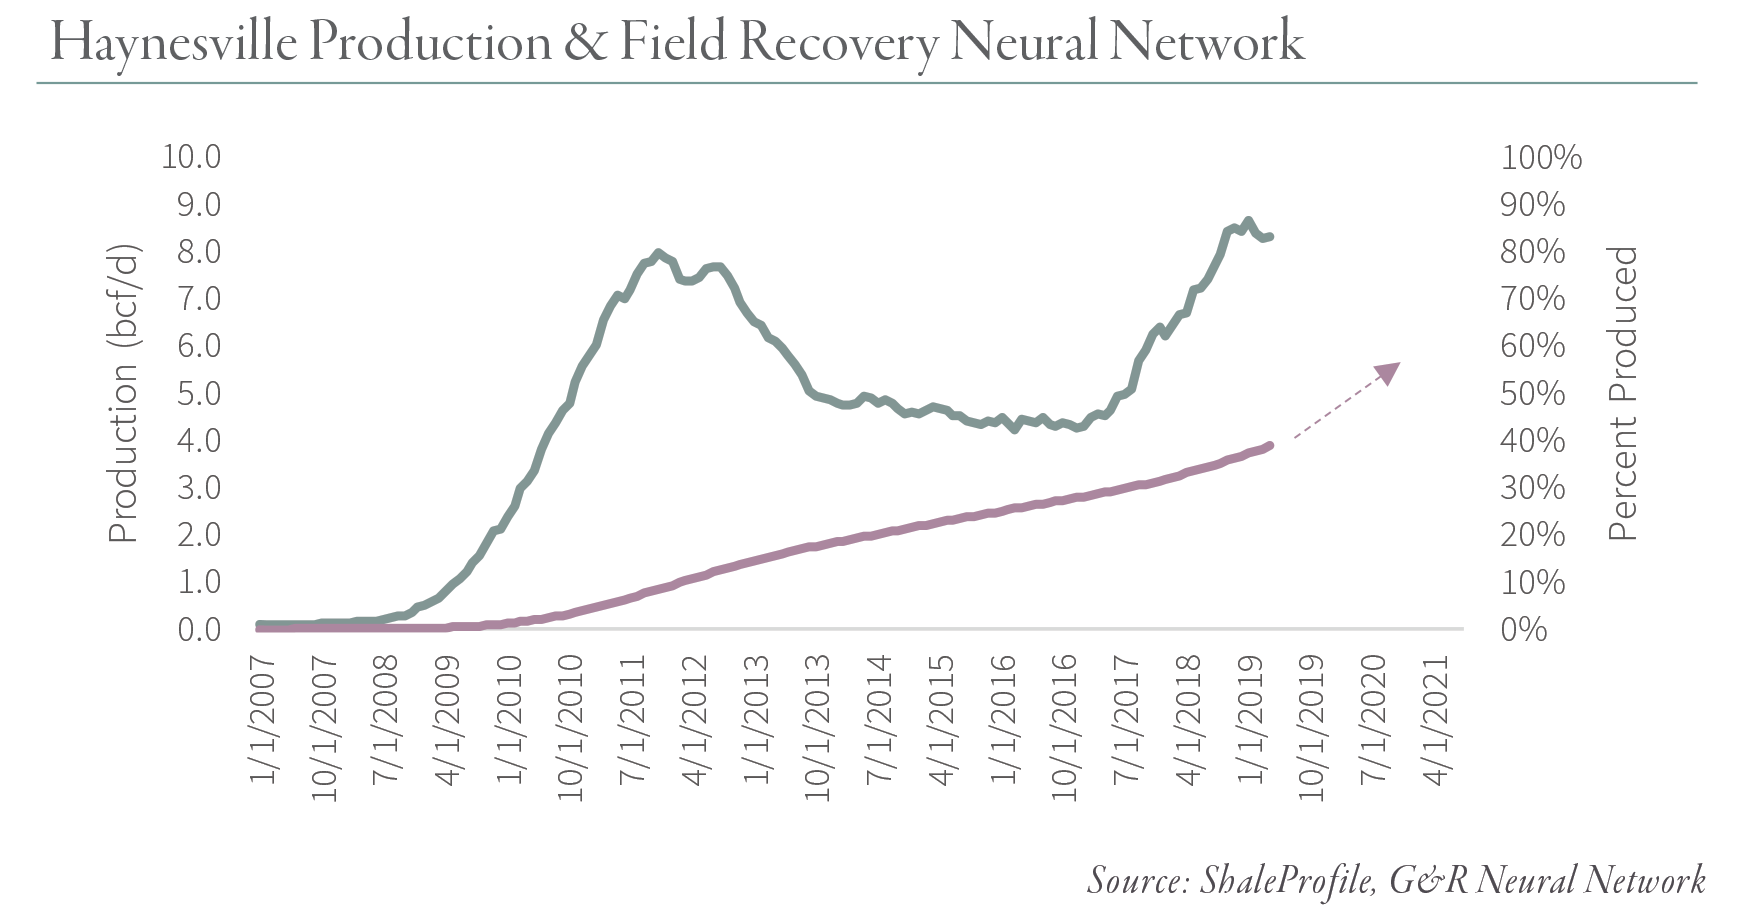
The neural network is equally as insightful when considering the Haynesville. Our models identified 10,000 possible drilling locations that will recover 50 tcf of natural gas in aggregate. As we discussed in a previous blog post (Natural Gas: A Potential Turning Point in a Decade's Long Bear Market?), production from the Haynesville first peaked at 8 bcf/d in 2011 before declining by nearly half. The field had only produced 4.5 tcf of gas by 2011 and in retrospect, given we expect the total recoverable reserves are 50 tcf, it is no surprise that production picked back up. Indeed, today production is nearing 10 bcf/d – nearly 20% higher than the last peak. We estimate the Haynesville’s cumulative production to date is approximately 20 tcf or 40% of projected total. As such, we believe the Haynesville will continue to grow somewhat from here.
What predictions can we make about the Marcellus? A Hubbert Linearization of the Marcellus is somewhat problematic because the field has been pipeline constrained for much of its development (Hubbert’s theories apply to unconstrained development). Looking at the plot, Marcellus production appears to still be in its early “noisy” stage of growth before the linearization settles into a straight line from which recoverable reserves can be estimated. This is precisely why we have avoided making a prediction about the Marcellus in our past letters.
Our model identified 20,000 drilling locations in the Marcellus of which 14,000 have been drilled to date. In total, we expect these wells will recover 92 tcf of natural gas making the Marcellus nearly twice as large as the second largest shale gas field, the Haynesville. We estimate the Marcellus has produced 37 tcf of gas to date, or 40% of the total recoverable reserves. This implies that the Marcellus can continue to grow until another 8 tcf of gas has been produced.
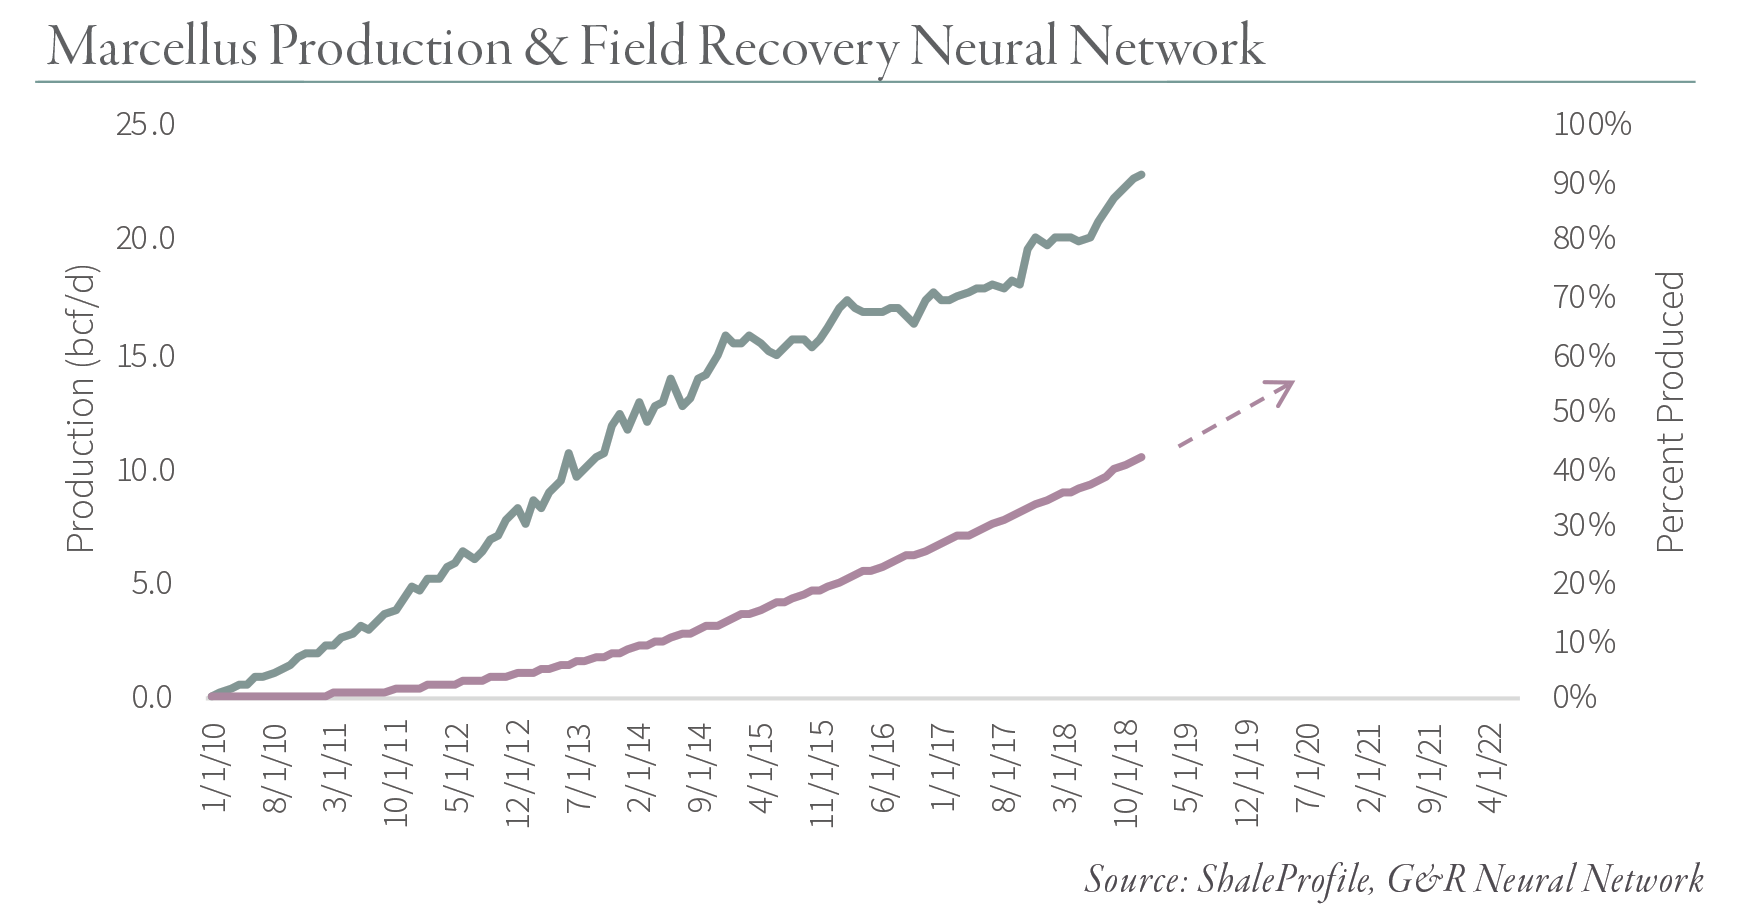
At today’s production levels this amounts to only another 12 months before the Marcellus has produced half of its ultimate recoverable reserves. While this claim may sound shocking, if we extrapolate the Hubbert Linearization from the last 30 months of data, it implies total recoverable reserves of 90 tcf of gas, very close and consistent with the recoverable reserve estimate made by our neural network.
If this analysis is correct, then the largest bearish factor in today’s natural gas market (i.e. Marcellus production) may be nearing an end.
In our Q3 2019 commentary, WHAT IS HAPPENING TO US SHALE PRODUCTION?, we explore this subject and many others. If you are interested in reading our in-depth research piece, please download the document below.
