For the third consecutive year, the only source of non-OPEC supply growth has come from the US shales. This trend will likely continue, although we believe shale production growth will likely slow.

photo source: http://www.whiteowl-services.com/
While shale oil in the United States has been a terrific success story, we believe the ultimate sizes of the shale basins in the United States have been overstated. In particular, we believe the Eagle Ford and Bakken shales are exhibiting their first signs of exhaustion. While the Permian Basin still has substantial development potential ahead, it cannot meet global demand growth alone.
The fact that many energy companies have been running out of top-tier drilling locations in the Eagle Ford and Bakken, and are being forced to drill locations that are up to 50% less productive, has been a theme we have been writing about for the past few years. At the same time, these companies were massively increasing their completion intensity (by injecting more proppant), which was offsetting the impact of moving to Tier 2 locations. As increased completion intensity began to hit its practical and economic limits, we felt that productivity (and later, production) would begin to slow in the Bakken and Eagle Ford. Our models continue to suggest production will slow in these plays going forward, however, it has not shown up yet in the production data.
We are often early with our research and we always lay out a set of mile-markers we need to pass to make sure we are headed in the right direction. While we have not yet seen production roll over in the Bakken and Eagle Ford, we have passed one important mile-marker confirming these fields are indeed facing exhaustion: drilling activity has been very weak even as oil prices have recovered.
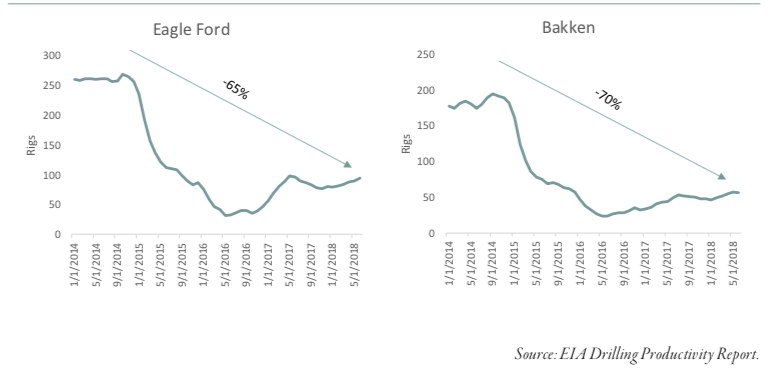
For example, back in the fall of 2014 with oil prices at $70 per barrel, there were 270 rigs turning in the Eagle Ford and 190 rigs turning in the Bakken. Oil prices proceeded to fall by 65% before bottoming in February 2016 at $26 per barrel. Drilling activity bottomed a few months later in May with only 32 rigs turning in the Eagle Ford and 24 rigs turning in the Bakken (down 88% in both cases). Since then, oil prices have once again broken through $70 per barrel, however the rig count in each of these fields remains 65% and 70% below their Fall 2014 levels.
Drilling Activity in Eagle Ford and Bakken (2014 - 2018)
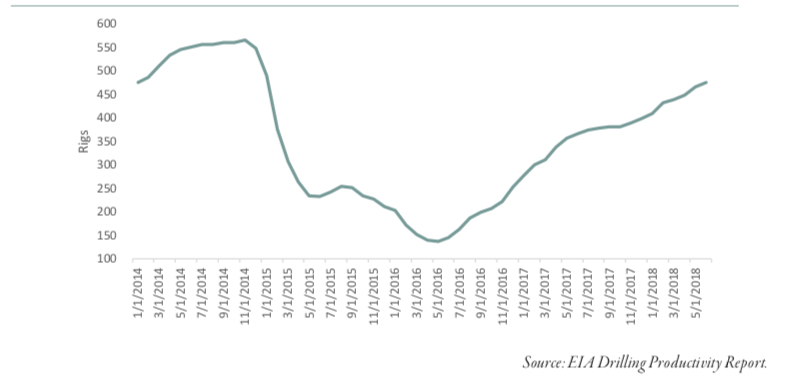
The slow ramp up of new drilling in the Eagle Ford and Bakken is remarkably different than what happened in the Permian. In the fall of 2014, the Permian basin had 560 rigs turning. Like the Bakken and Eagle Ford, drilling activity fell substantially and eventually bottomed in May 2016 nearly 80% below the fall 2014 level. However, as oil prices recovered to their late 2014 levels, drilling in the Permian has rebounded sharply and today stands only 15% below its late 2014 rate.
Drilling Activity in the Permian (2014 - 2018)
If all three shale basins had ample development potential ahead of them, we should expect to see drilling activity in all three behave in a similar way. Instead, activity in the Bakken and Eagle Ford are acting very much like each other, but very differently from the Permian. Our analysis tells us that the only material difference between the plays is that the Permian has ample Tier 1 drilling inventory remaining whereas the Bakken and Eagle Ford are in the process of running out. If we are correct, we would expect to see production from the Bakken and Eagle Ford begin to disappoint in the quarters to come. Should production increase materially from here, we will have to revisit our thesis, but so far, the slow level of drilling activity in these plays suggests to us that we are on the right track.
This blog is part of a series "The Case for Continued Bull Market in Oil Prices". To read more, here are the links to part 1 and part 2.
To read more of our research, download our Q2 2018 commentary.